
XAU/USD’s broader trend remains firm to the upside, but the Daily chart is still in a downward sub-trend. The latest Daily close is positioned between Fibonacci levels, leaving the support zone at 4164.615 – 4203.224 and resistance at 4658.488 – 4697.097 as important areas for assessing whether the pullback persists or the broader advance resumes.
Higher-timeframe context
The Weekly trend is up and firm, while its sub-trend is down. The report records no structure event, so there is no confirmed structure break to establish a change in the larger trend. The most recent confirmed Weekly swing high is 5595.362.
The Weekly close is 4285.936. The broader chart has resistance at 5019.871 – 5595.362 and support at 2536.779 – 2650.336. A separate support zone at 2676.542 – 2790.099 is identified as broken-retest. These areas frame the larger structure, but the report does not identify a current Weekly structure event.
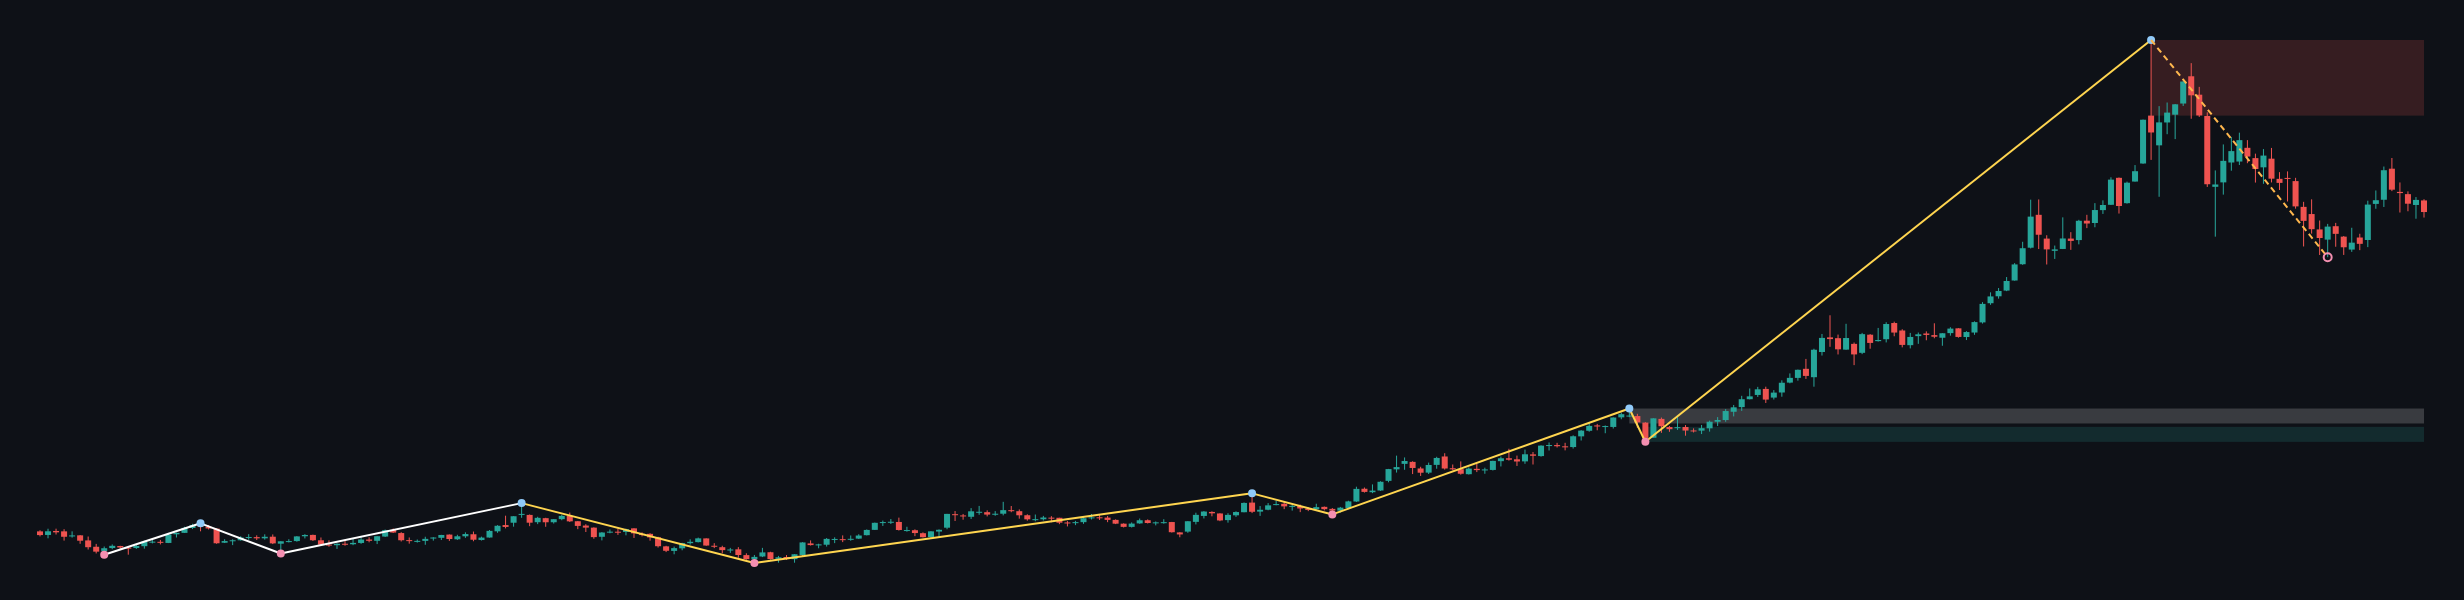
Weekly conclusion: The firm primary uptrend keeps the broader directional backdrop constructive, while the declining sub-trend argues for caution until price action confirms that the pullback has eased.
Main-frame structure
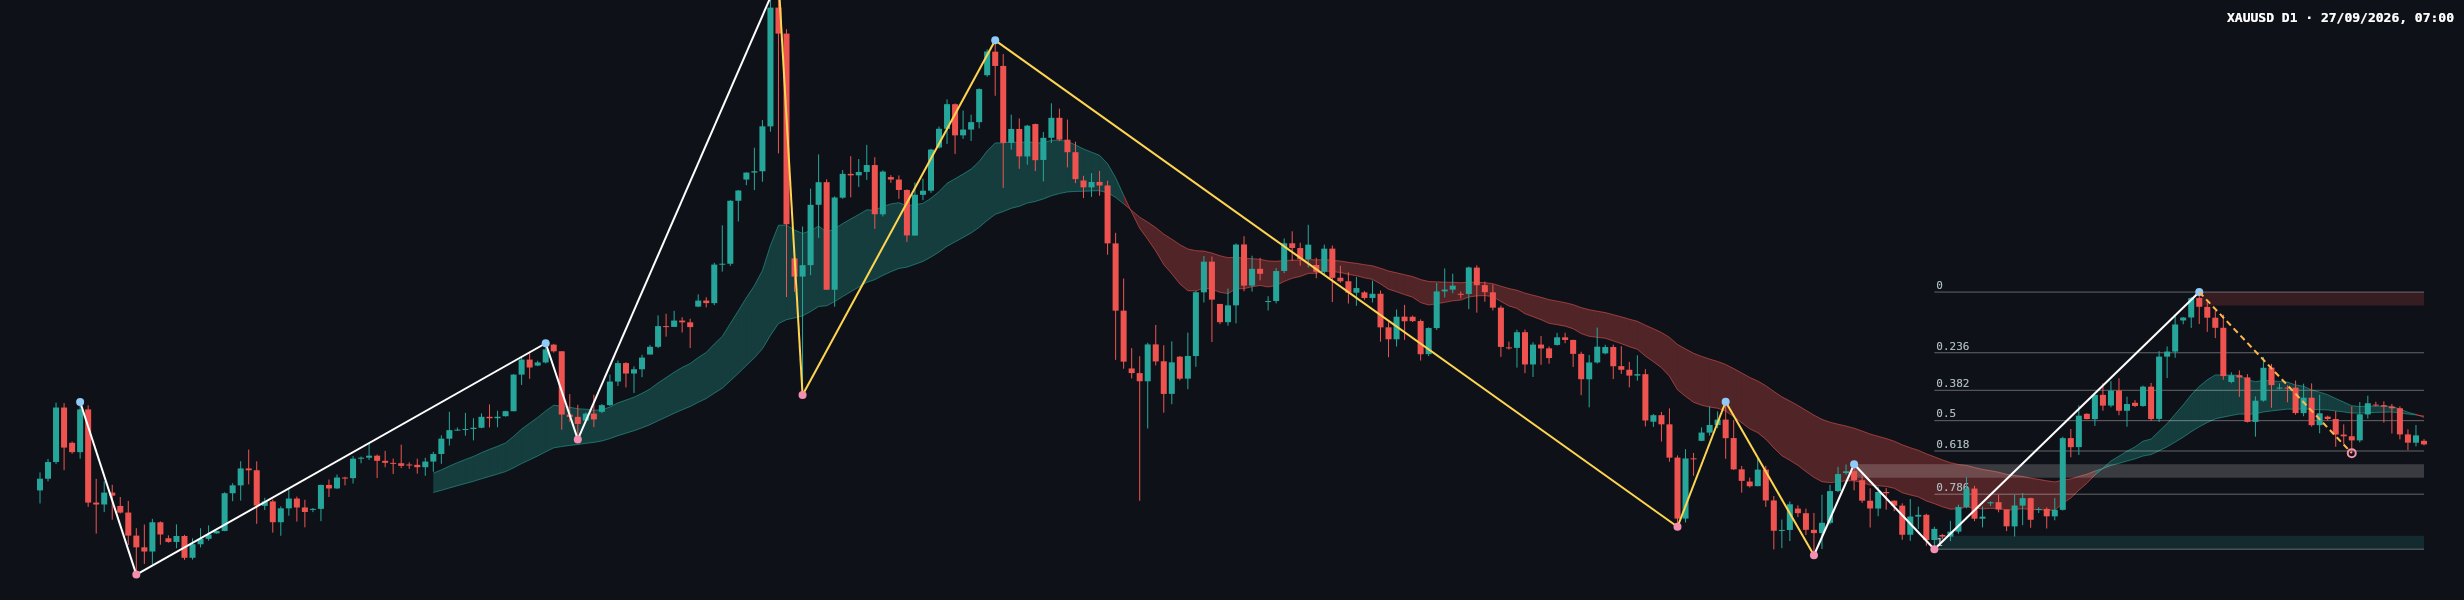
The Daily trend is also up and firm, with a down sub-trend, matching the Weekly picture. The Daily close is 4260.147, and no structure event is recorded. The most recent confirmed Daily swing high is 4697.097.
The chart shows a decline from the swing high followed by a partial recovery and renewed softness near the latest bars. The supplied data does not provide candle-by-candle OHLC values, EMA readings, volume, or momentum measurements, so the precise candle types, relative candle ranges, EMA positioning, and volume confirmation are not determinable from the report. The available evidence supports describing the current phase as a pullback within a still-firm primary trend, rather than claiming a confirmed reversal.
The reported current retracement ratio is 0.592. Price lies between the 0.5 Fibonacci level at 4328.247 and the 0.618 level at 4241.198, closer to the latter. A sustained hold around the lower Fibonacci area would be consistent with a stabilizing pullback; a decisive move through it would leave deeper support in focus.
Key levels
| Area | Level | Technical context |
|---|---|---|
| Daily resistance | 4658.488 – 4697.097 | Resistance zone and most recent confirmed swing high. |
| Fibonacci reference | 4328.247 | 0.5 level, above the latest Daily close. |
| Fibonacci reference | 4241.198 | 0.618 level, below the latest Daily close. |
| Broken-retest support | 4164.615 – 4203.224 | Nearby support zone to monitor if the pullback extends. |
| Lower Daily support | 3959.396 – 3998.005 | Deeper support zone in a more extended decline. |
Scenarios
- Bullish scenario: If price holds above the 0.618 level at 4241.198 and recovers above the 0.5 level at 4328.247, the pullback could lose momentum and attention could return to the resistance zone at 4658.488 – 4697.097. A sustained move below 4241.198 would weaken this scenario.
- Bearish scenario: If price moves below 4241.198 and then gives way through the support zone at 4164.615 – 4203.224, the decline could extend toward 3959.396 – 3998.005. A recovery above 4328.247 would weaken this scenario.
- Range scenario: If price remains between 4241.198 and 4328.247, the evidence would remain mixed, with neither side establishing a clear shift. A sustained move outside this band would challenge the range interpretation.
The report does not provide a probability model or an intraday trading range, so neither can be responsibly quantified here. The bias remains cautious: the larger uptrend is intact, but the Daily sub-trend and the position near the lower Fibonacci reference leave downside support relevant.
Session considerations
For confirmation, watch whether price holds or loses 4241.198, how it behaves around 4164.615 – 4203.224, and whether it can reclaim 4328.247. A move through a level without sustained follow-through could prove misleading, so confirmation from subsequent price action matters.
No economic-calendar schedule or specific news context was supplied. Traders may wish to remain alert to changes in the US dollar, Treasury yields, scheduled US data, central-bank communication, and geopolitical headlines; the timing and impact of any such events cannot be determined from the available information. Session-specific behavior is likewise not established by this report.
Summary
- The Weekly and Daily primary trends are up and firm, but both sub-trends are down.
- The Daily close at 4260.147 is between the 0.5 level at 4328.247 and the 0.618 level at 4241.198.
- The nearby support zone is 4164.615 – 4203.224; lower support is 3959.396 – 3998.005.
- Daily resistance at 4658.488 – 4697.097 remains the key higher area to monitor.
The single most important point is whether price can hold the 0.618 reference or instead breaks into the nearby support zone.
#XAUUSD #Gold #TechnicalAnalysis #PriceAction #MarketOutlook
Meta description: XAU/USD Daily analysis: gold’s firm broader trend meets a continuing pullback near Fibonacci references and key support.
This article is technical analysis and reference information only, not investment advice. Markets carry risk, and readers are responsible for their own decisions.