
XAU/USD’s broader trend remains up on both the weekly and daily charts, while the sub-trend is down on each. The daily close is 4363.780, between the Fibonacci levels at 4328.247 and 4415.295. The near-term picture therefore remains a pullback within a larger uptrend unless price establishes a clearer break of the surrounding support or resistance zones.
Higher-timeframe context
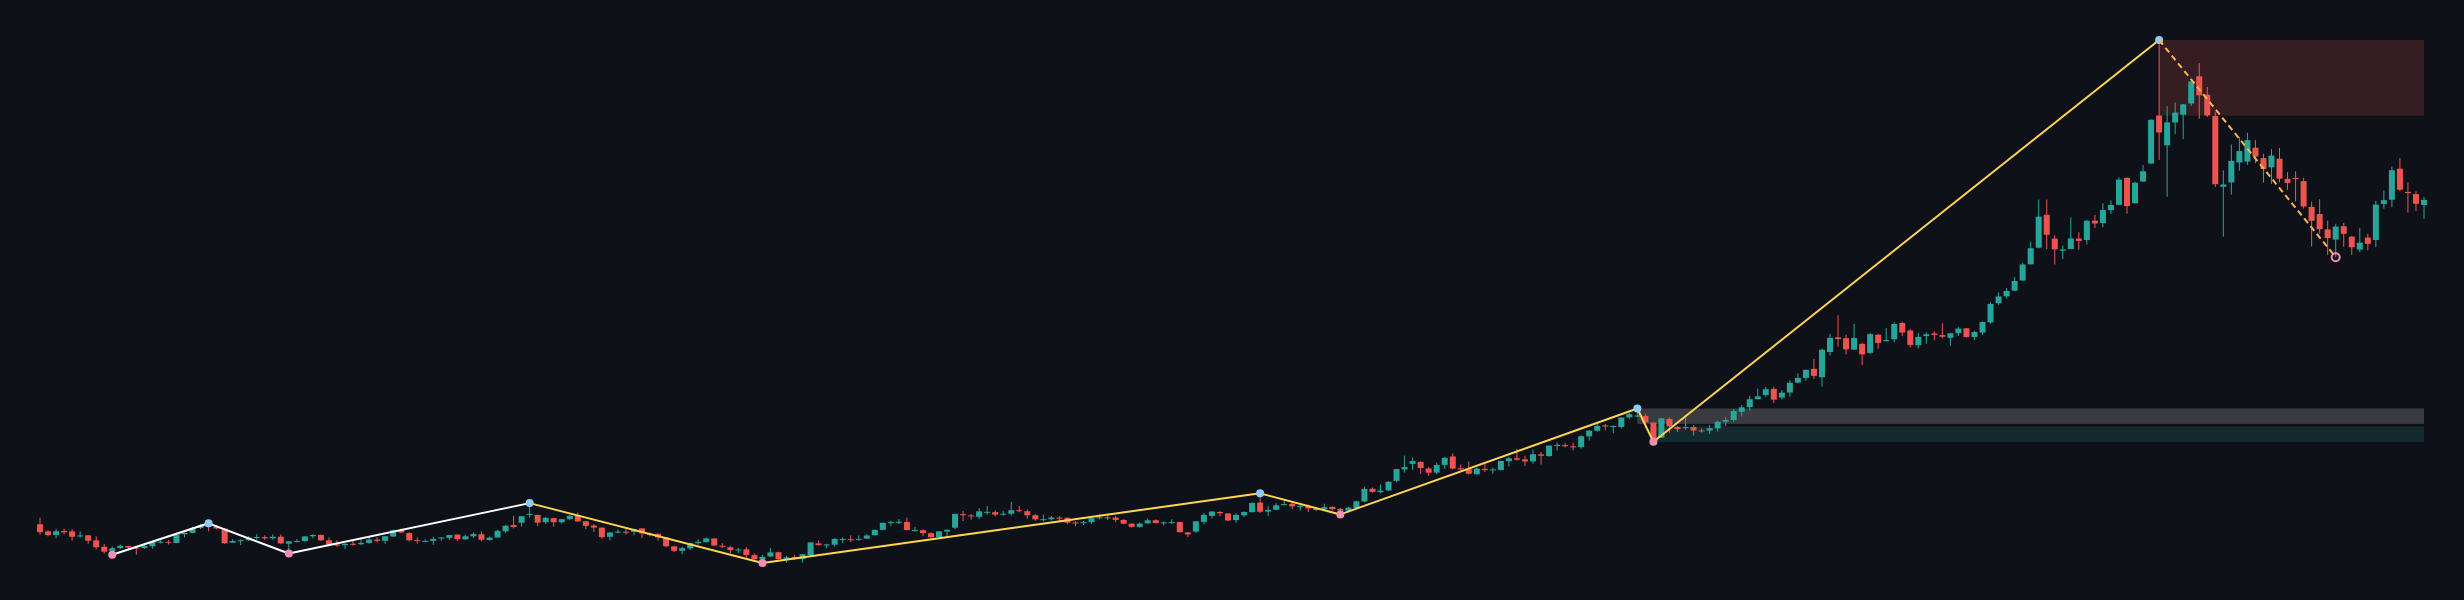
The weekly chart shows a firm uptrend with a down sub-trend and no reported structure event. Its most recent confirmed swing is a high at 5595.362. Weekly resistance is marked at 5019.871–5595.362, while the reported support zones are 2673.168–2790.099, a broken-retest area, and 2536.779–2653.710. These are substantial zones on the weekly map; the report does not provide calculated distances from the latest weekly close of 4378.101.
This context supports keeping the larger upward structure in view, but the declining sub-trend cautions against treating it as an immediate bullish signal. The weekly ATR is 233.862; it describes volatility, not a directional forecast.
Main-frame structure
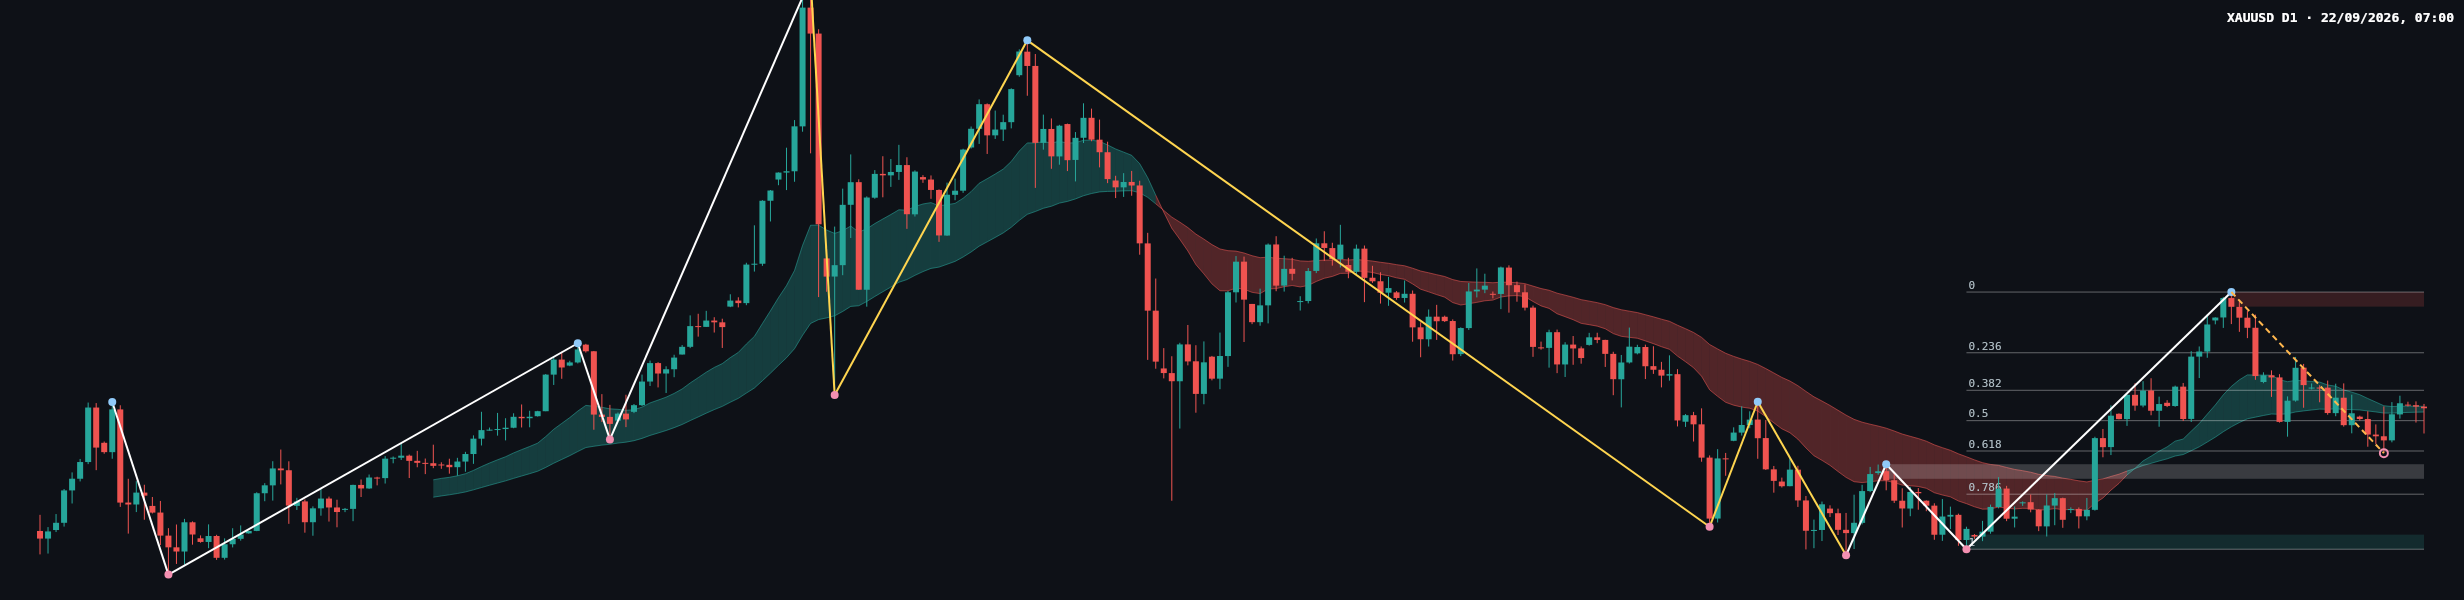
On the daily chart, the main trend is also up and firm, with a down sub-trend. No structure event is reported, and the most recent confirmed swing high is 4697.097. The daily close of 4363.780 is below that swing high and sits between Fibonacci levels 4328.247 and 4415.295. The current retracement ratio is 0.452.
The chart depicts a retreat from the confirmed high followed by uneven price action. The available report does not classify the latest candle or give candle-by-candle measurements, so a specific claim about its body, wick, or close within its range would be unwarranted. Volume and momentum readings are also not provided. The daily ATR is 83.422 and should be treated as context for volatility, not as a projected move.
The daily support zone at 4161.513–4203.224 is identified as a broken-retest area. Below it, another reported support zone lies at 3959.396–4001.107. Daily resistance is marked at 4655.386–4697.097. The higher-timeframe and daily trends align in their primary direction, while both sub-trends point down: the pullback remains relevant, but the report does not confirm a reversal.
Key levels
- Fibonacci reference: 4415.295 is the 0.382 level; 4328.247 is the 0.5 level. The close at 4363.780 lies between them.
- Further Fibonacci levels: 4523.000 is 0.236; 4241.198 is 0.618; 4117.264 is 0.786; and 3959.396 is 1.
- Daily resistance: 4655.386–4697.097, with the confirmed swing high at 4697.097.
- Daily support: 4161.513–4203.224, the broken-retest zone; and 3959.396–4001.107.
- Weekly context: 5019.871–5595.362 resistance, with weekly support at 2673.168–2790.099 and 2536.779–2653.710.
These levels are reference areas, not instructions to trade. The report does not supply calculated distances, event timing, or probability estimates.
Conditional scenarios
- Bullish continuation: A sustained daily move above 4655.386–4697.097 would improve the case for a resumption of the broader uptrend. The weekly resistance zone at 5019.871–5595.362 would then be a higher-timeframe area to monitor, not a guaranteed destination. A return below 4655.386 after a break would weaken this scenario.
- Bearish extension: A decisive move below the 4161.513–4203.224 support zone would increase the risk of further retracement, bringing 3959.396–4001.107 into focus. A recovery above 4203.224 would weaken this downside scenario.
- Range and indecision: If price continues to hold between 4328.247 and 4415.295, the daily chart would remain caught between these Fibonacci references without a clear resolution. A break beyond either boundary would invalidate this narrow range framing and shift attention to the next reported zones.
For now, the weekly uptrend is the broader backdrop, but the daily down sub-trend leaves both continuation and further pullback conditional on how price responds to the stated levels.
Closing perspective
The most useful distinction is between the broader upward structure and the current daily pullback: a move through daily resistance would strengthen the continuation case, while a loss of the broken-retest support would increase downside risk. Until either develops, the Fibonacci band around the latest close remains a nearby reference for assessing whether the pullback is stabilizing.
Meta description: XAU/USD daily analysis covering the weekly backdrop, Fibonacci references, support and resistance zones, and conditional scenarios.
This article is technical analysis for information only and is not investment advice. Markets carry risk, and readers are responsible for their own decisions.