
XAU/USD remains structurally bullish on the weekly and daily frameworks, but both charts retain a down sub-trend. The daily close at 4423.137 is positioned close to the latest Fibonacci reference at 4415.295, making this the main area for assessing whether the correction is stabilising or extending.
| Metric | Value |
|---|---|
| Weekly last closed price | 4430.194 |
| Daily last closed price | 4423.137 |
| Weekly trend | Up, firm; sub-trend down |
| Daily trend | Up, firm; sub-trend down |
| Nearest resistance | 4650.758 – 4697.097 |
| Nearest support | 4156.885 – 4203.224 |
| Active Fibonacci reference | 0.382 at 4415.295 |
| Current retracement ratio | 0.371 |
Higher-timeframe context
The weekly main trend is up and described as firm, while the sub-trend is down. The most recent confirmed weekly swing high is 5595.362, and the report identifies no weekly structure event. This keeps the broader advance intact while showing that price is still working through a pullback from the higher swing.
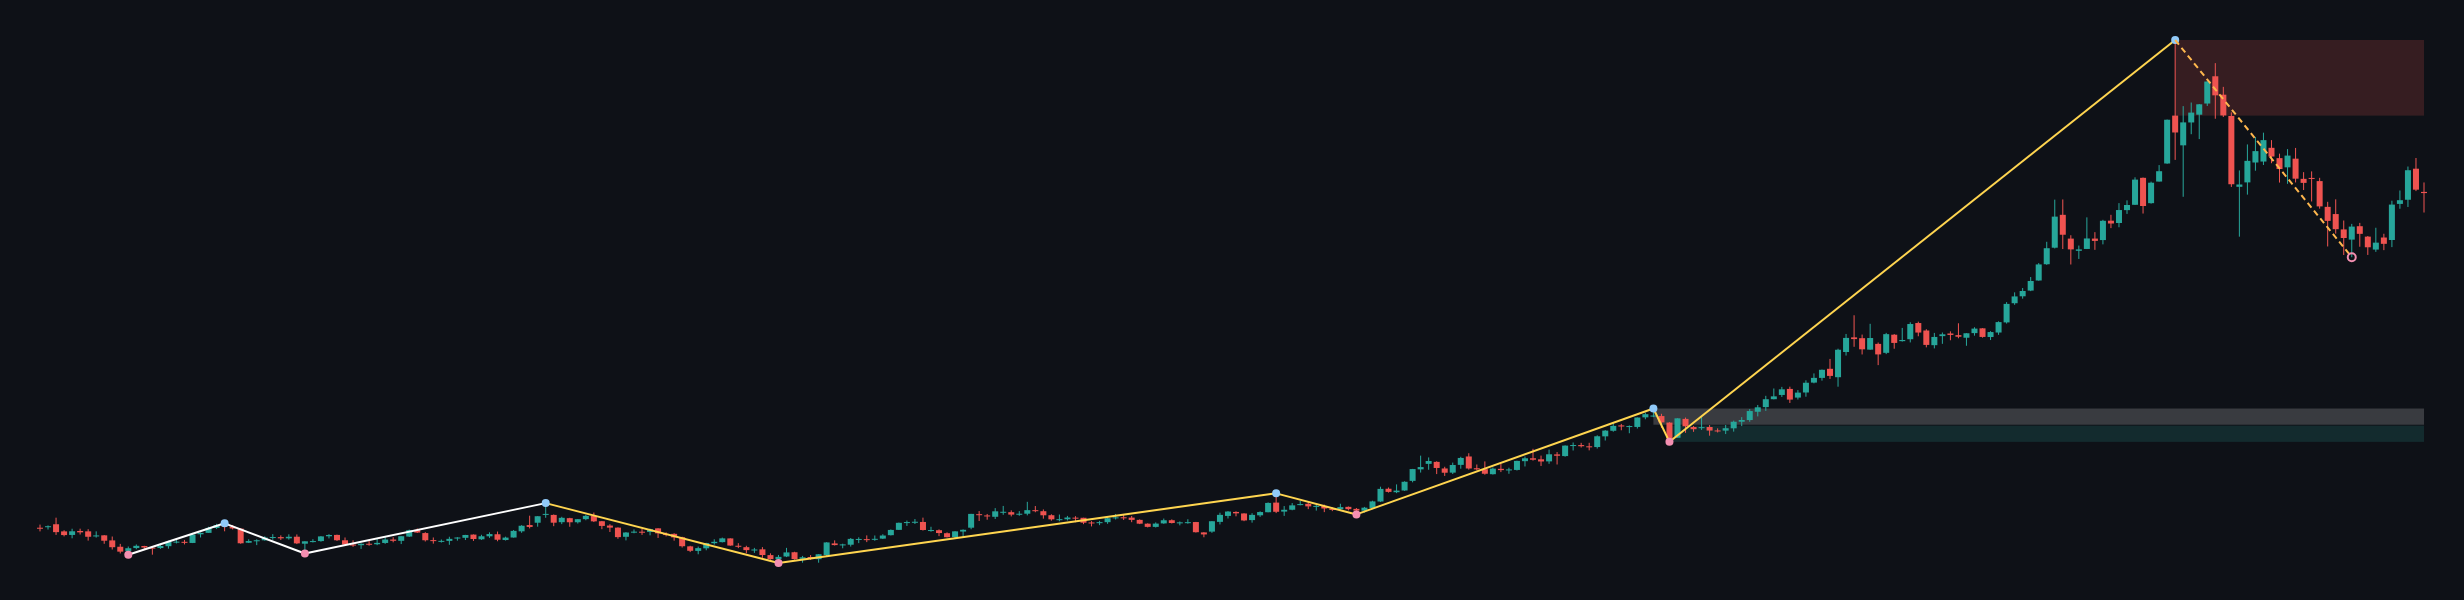
Weekly support is marked at 2536.779 – 2659.747, with a further broken-retest support zone at 2667.131 – 2790.099. These areas are materially below the current close and represent wider structural demand rather than immediate daily decision points. Weekly resistance is located at 5019.871 – 5595.362, placing the current market below the larger supply area.
The weekly ATR is 245.936. The report does not provide numerical values for the weekly EMA bands, so their exact spacing, slope, and crossover status are not determinable from the supplied data. The higher-timeframe conclusion is therefore conditional: the uptrend remains the dominant framework above the major weekly supports, but the sub-trend remains corrective until resistance is reclaimed or a fresh structure event appears.
Main-frame structure
The daily main trend is also up and firm, aligning with the weekly direction. However, the daily sub-trend is down, so the immediate price action is best treated as a pullback within the broader advance rather than as a confirmed reversal. No daily structure event is reported.
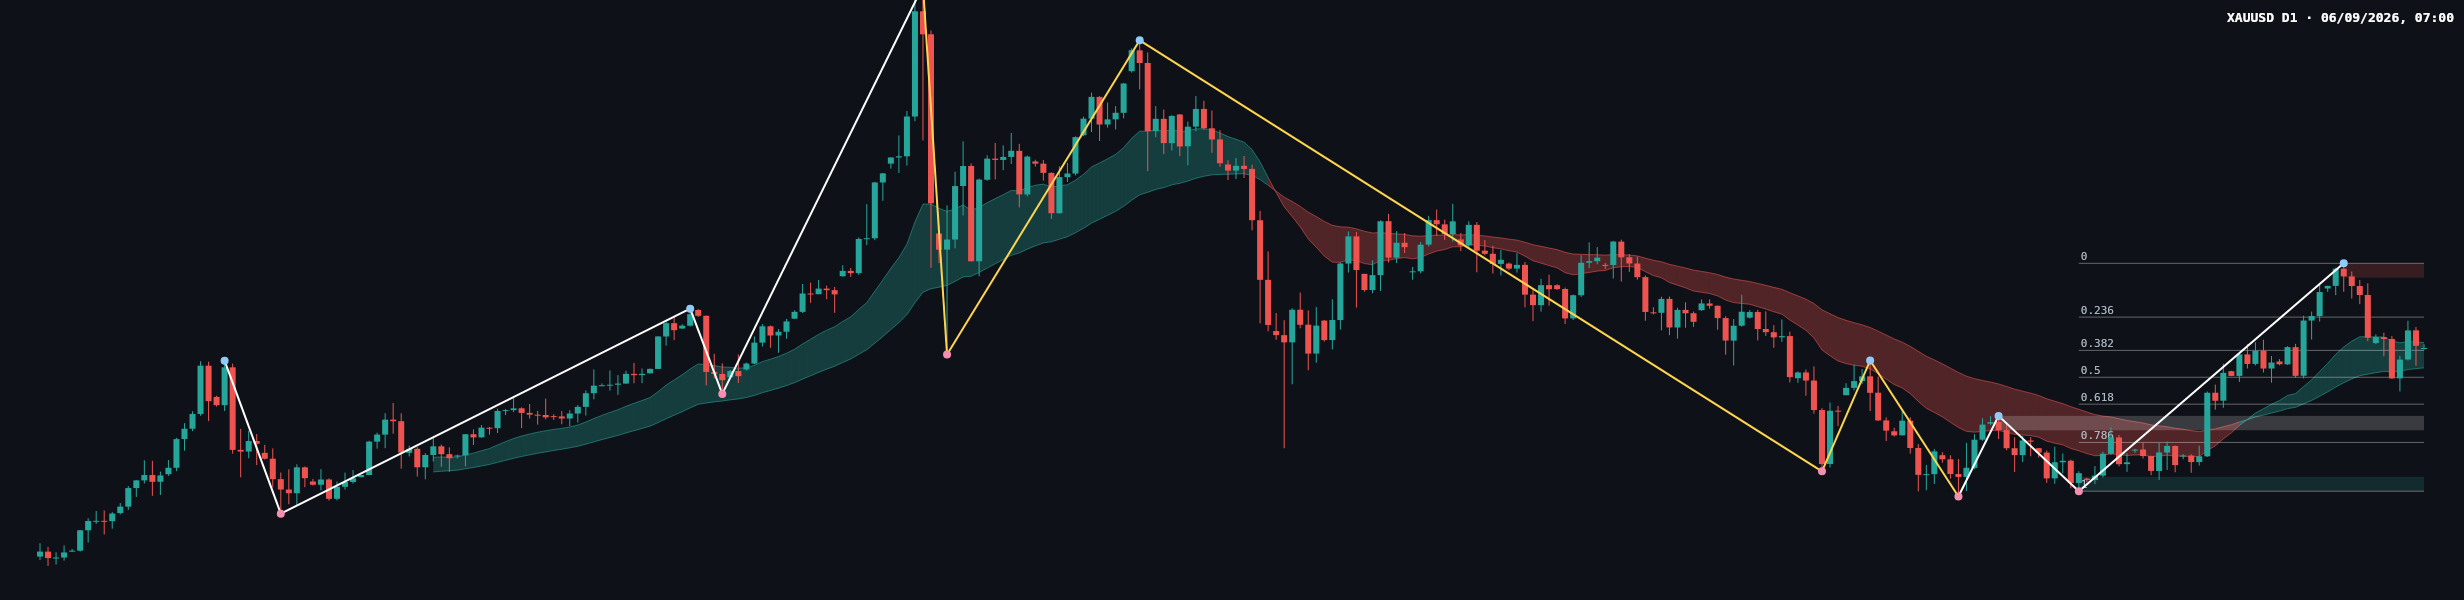
The most recent confirmed daily swing high is 4697.097. Daily resistance spans 4650.758 – 4697.097, while the broken-retest support zone is 4156.885 – 4203.224. A deeper support zone is marked at 3959.396 – 4005.735. The daily ATR is 92.678, indicating that price can move meaningfully between these structural areas without necessarily changing the broader trend.
The report does not provide the numerical values of the daily EMA bands. Their exact distance from the close, slope, and crossover condition are therefore not determinable from the chart data report. Price action nevertheless shows a recovery from the lower daily support area followed by hesitation beneath the upper resistance zone.
Key levels and Fibonacci reading
The latest completed daily Dow leg runs from 4697.097 to 3959.396. Its Fibonacci references are 4523.000 at 0.236, 4415.295 at 0.382, 4328.247 at 0.5, 4241.198 at 0.618, and 4117.264 at 0.786.
The current retracement ratio is 0.371, placing price close to the 0.382 reference at 4415.295. The daily close at 4423.137 is only marginally above that level in structural terms. Holding this reference would keep the rebound case active, while sustained acceptance below it would expose the next Fibonacci references at 4328.247 and 4241.198.
Recent candle and price-action reading
The right side of the daily chart shows a recovery from the broken-retest support region at 4156.885 – 4203.224, followed by a move toward the upper part of the recent range. Price then encountered resistance near the latest swing high at 4697.097 and pulled back toward the Fibonacci area around 4415.295.
The most recent candles appear compressed around the current close rather than displaying a decisive directional expansion. This suggests a balance between buyers defending the area around 4415.295 and sellers still active below 4523.000. A close above 4523.000 would improve the recovery structure, while a close below 4415.295 would increase the risk of a deeper retracement.
Volume and momentum values are not included in the deterministic report, so confirmation or divergence from those measures is not determinable. The visible price structure alone remains mixed: the broader trend is bullish, but the corrective daily sequence has not yet produced a reported structure break.
Conditional scenarios
Primary scenario: support holds
If price holds above 4415.295 and regains 4523.000, the recovery could extend toward the daily resistance zone at 4650.758 – 4697.097. This scenario would be weakened by sustained acceptance below 4415.295. The report supplies no probability estimates, so no numerical probability is assigned.
Secondary scenario: Fibonacci support fails
If price breaks and remains below 4415.295, the corrective move could continue toward 4328.247, followed by 4241.198 and the support zone at 4156.885 – 4203.224. Reclaiming 4523.000 would weaken this bearish continuation scenario.
Risk scenario: resistance is reclaimed
If price breaks above 4697.097 and holds above the daily resistance zone at 4650.758 – 4697.097, attention could shift toward the weekly resistance zone at 5019.871 – 5595.362. A return below 4650.758 would invalidate the immediate breakout interpretation and restore the range between Fibonacci support and daily resistance.
Key considerations
- Resistance: monitor 4523.000 first, then 4650.758 – 4697.097, with the wider weekly zone at 5019.871 – 5595.362.
- Support: the first structural reference is 4415.295, followed by 4328.247, 4241.198, and 4156.885 – 4203.224.
- Deeper support: the daily zone at 3959.396 – 4005.735 is the next major downside reference if the broken-retest area fails.
- Confirmation: a sustained close above 4523.000 would support recovery, while a sustained close below 4415.295 would favour continuation of the pullback.
- Traps: false breaks around 4415.295 and 4523.000 may create conflicting signals, particularly during periods of elevated gold volatility.
- Fundamentals: traders may monitor the DXY, United States yields, inflation data, employment data, central-bank communication, and geopolitical headlines. No specific scheduled event time is provided in the report.
The Asian, European, and United States sessions can produce different levels of liquidity and volatility in gold. In the current technical context, the key issue is whether those flows produce acceptance above 4523.000 or rejection below 4415.295, rather than the session label alone.
Summary
- The weekly and daily main trends remain up and firm.
- Both timeframes retain down sub-trends, so the current move remains corrective.
- The central daily reference is 4415.295, corresponding to the 0.382 Fibonacci level.
- A recovery above 4523.000 would improve the bullish case toward 4650.758 – 4697.097.
- A sustained move below 4415.295 would expose 4328.247, 4241.198, and the support zone at 4156.885 – 4203.224.
The single most important consideration is whether price can defend 4415.295 while remaining below the daily resistance zone at 4650.758 – 4697.097.
SEO meta description: XAU/USD tests 4415.295 Fibonacci support as the broader uptrend meets a daily corrective phase. Key resistance and conditional scenarios explained.
#XAUUSD #GoldAnalysis #PriceAction #Fibonacci #TechnicalAnalysis
This article is technical analysis and reference information only, not investment advice. Markets carry risk, and readers are responsible for their own decisions.