
GBPUSD closed at 1.32313, above the daily support zone but below the first marked Fibonacci retracement level. The larger trend remains down on both the weekly and daily frames, while the reported sub-trend is up; the balance therefore hinges on whether price can recover nearby resistance or loses support.
Higher-timeframe context
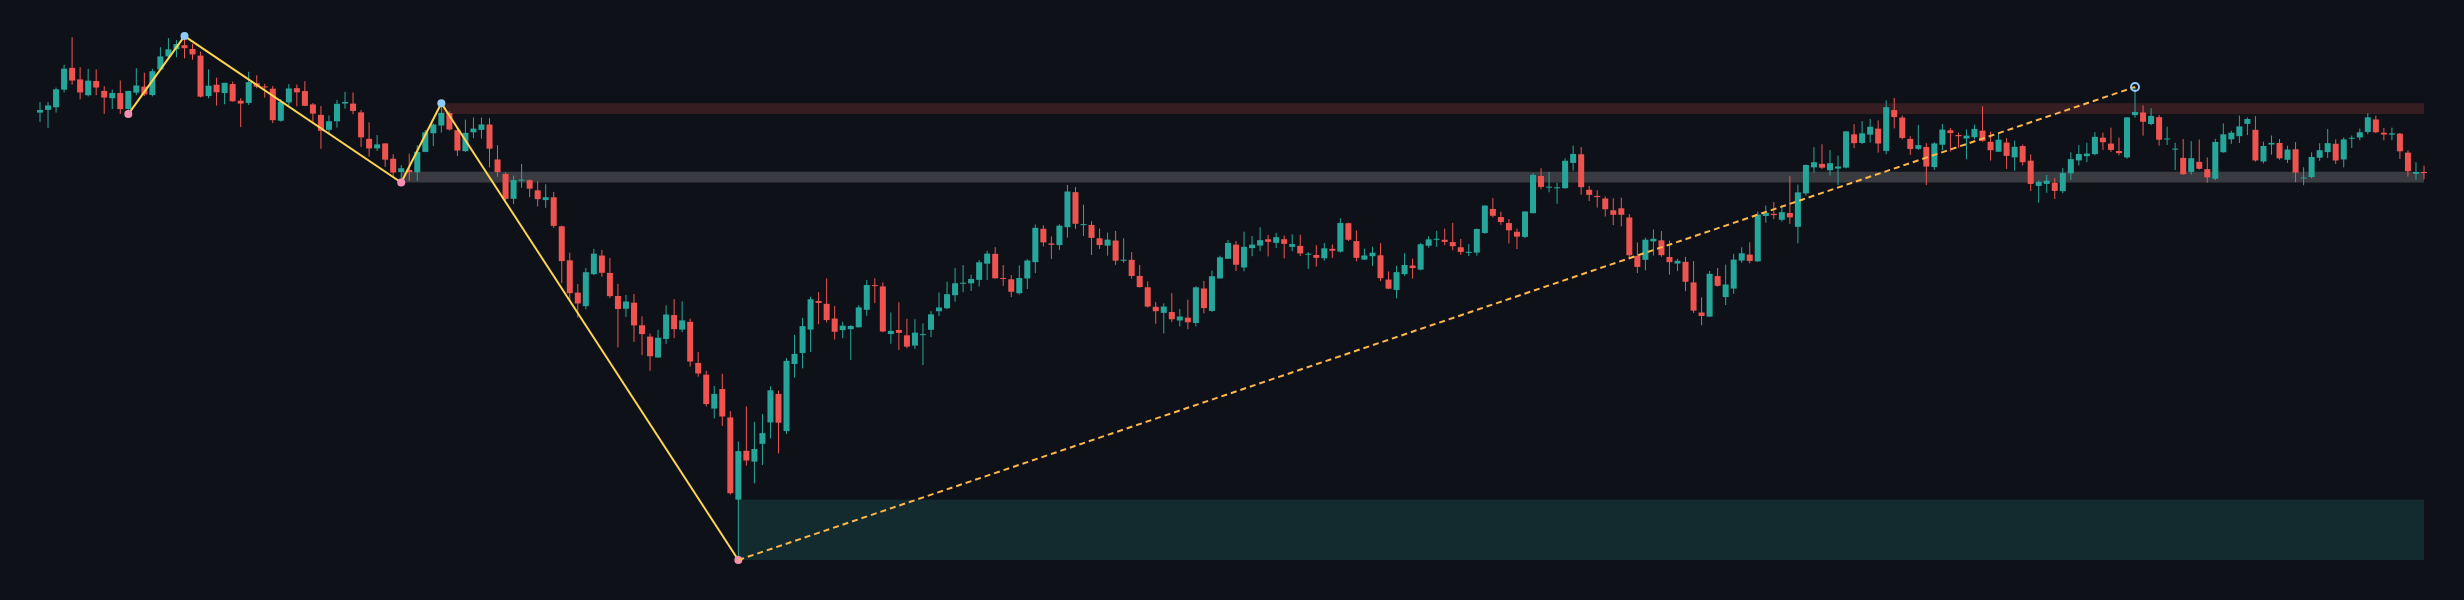
The weekly trend is down and firm, with an up sub-trend. The report records no structure event and identifies the most recent confirmed swing as a low at 1.03535. Price is currently within the weekly broken-retest resistance zone at 1.31602 – 1.32401, making this a meaningful area to watch rather than a confirmed breakout.
The broader weekly resistance zone is 1.36688 – 1.37487, while the marked weekly support zone is 1.03535 – 1.08025. Weekly Fibonacci data is not provided, so no weekly retracement level can be confirmed. The context favors caution toward the recovery unless price can establish itself above the nearby resistance area.
Main-frame structure
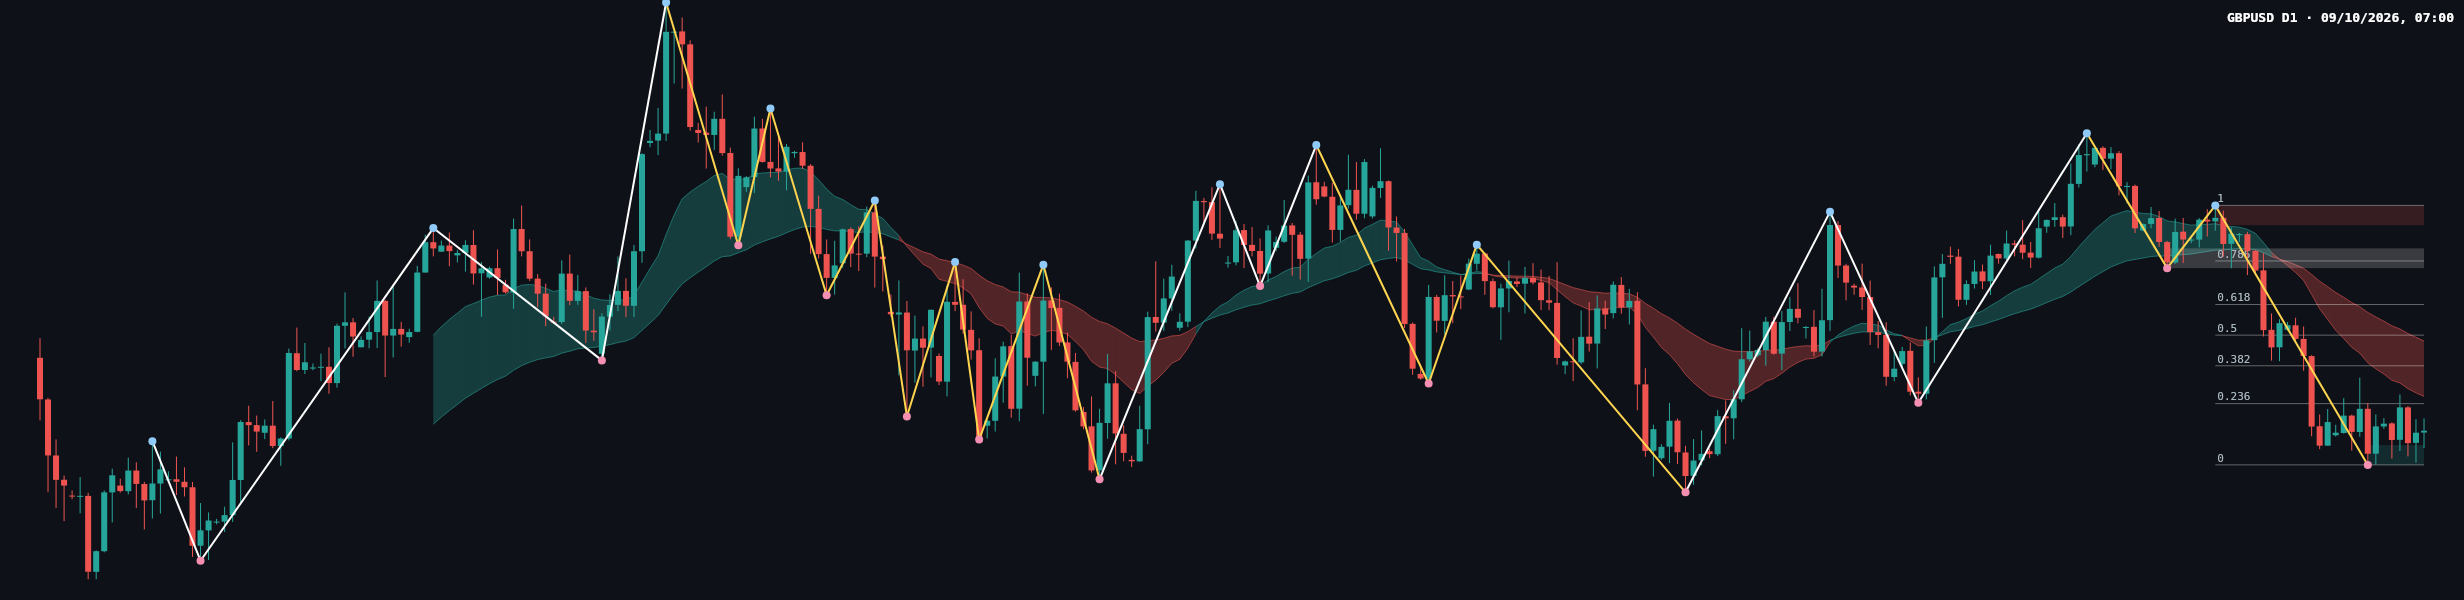
On the daily chart, the main trend is also down and firm, with an up sub-trend. No structure event is reported, and the most recent confirmed swing low is 1.31804. The close at 1.32313 remains above the daily support zone of 1.31804 – 1.32099, but has not reached the Fibonacci 0.236 level at 1.32718.
The latest completed Dow leg has a reported current retracement ratio of 0.131. This places the recovery below the first listed retracement marker, consistent with a rebound that has not yet overcome nearby resistance. The chart shows price falling from a recent swing high and then stabilizing around the low area; the supplied data does not establish a specific candlestick pattern, volume signal, or EMA reading. Exact EMA values and prior-session change are not provided.
Key levels
| Area | Level | Technical reference |
|---|---|---|
| Daily support | 1.31804 – 1.32099 | Support zone and area around the most recent confirmed swing low |
| Fibonacci reference | 1.32718 | 0.236 retracement level |
| Daily broken-retest resistance | 1.34740 – 1.35035 | Resistance zone |
| Daily resistance | 1.35381 – 1.35676 | Higher marked resistance zone |
| Weekly broken-retest resistance | 1.31602 – 1.32401 | Weekly resistance area containing the latest close |
Other listed Fibonacci references are 0.382 at 1.33283, 0.5 at 1.33740, 0.618 at 1.34197, 0.786 at 1.34847, and 1 at 1.35676. These are reference levels, not forecasts.
Scenarios
- Bullish recovery: A daily close above 1.32718, followed by a hold on a retest, would improve the recovery case. The next marked resistance area is 1.34740 – 1.35035. A move back below 1.31804 – 1.32099 would undermine this scenario.
- Bearish continuation: Rejection below 1.32718, followed by a close beneath the daily support zone at 1.31804 – 1.32099, would reinforce downside pressure. The broader weekly support zone is 1.03535 – 1.08025; the report does not identify an intervening downside target. A recovery above 1.32718 would weaken this scenario.
- Range: If support holds but price remains below 1.32718, consolidation between the daily support zone and that Fibonacci level remains possible. A sustained break beyond either boundary would invalidate this range framing.
The near-term bias remains cautious while price is below 1.32718; acceptance above it would improve the recovery picture, while a break of support would favor renewed weakness. No probability estimate is assigned because the supplied data does not provide one.
Summary
- The weekly and daily main trends are both reported as down and firm, with up sub-trends.
- The latest close at 1.32313 is above daily support and within the weekly broken-retest resistance zone.
- 1.32718 is the nearest listed Fibonacci test above the close; 1.31804 – 1.32099 is the key daily support zone.
- A close beyond either nearby boundary would help clarify whether recovery or renewed selling is taking control.
The single most important thing to monitor is whether price can reclaim 1.32718 or instead breaks below 1.31804 – 1.32099.
#GBPUSD #Forex #TechnicalAnalysis #DailyChart #MarketOutlook
GBPUSD daily analysis: price is above support but below the first Fibonacci retracement level, with bullish and bearish scenarios around key zones.
This article is technical analysis for reference only, not investment advice. Markets carry risk, and readers are responsible for their own decisions.