
GBPUSD closed at 1.32176, below the daily chart’s broken structure level at 1.32730. The daily trend is up but shaky, with a down sub-trend and a reported change of character; the weekly backdrop is a firm downtrend with an up sub-trend. Price is therefore at a point where the daily breakdown and the broader weekly resistance area need to be weighed together.
Higher-timeframe context
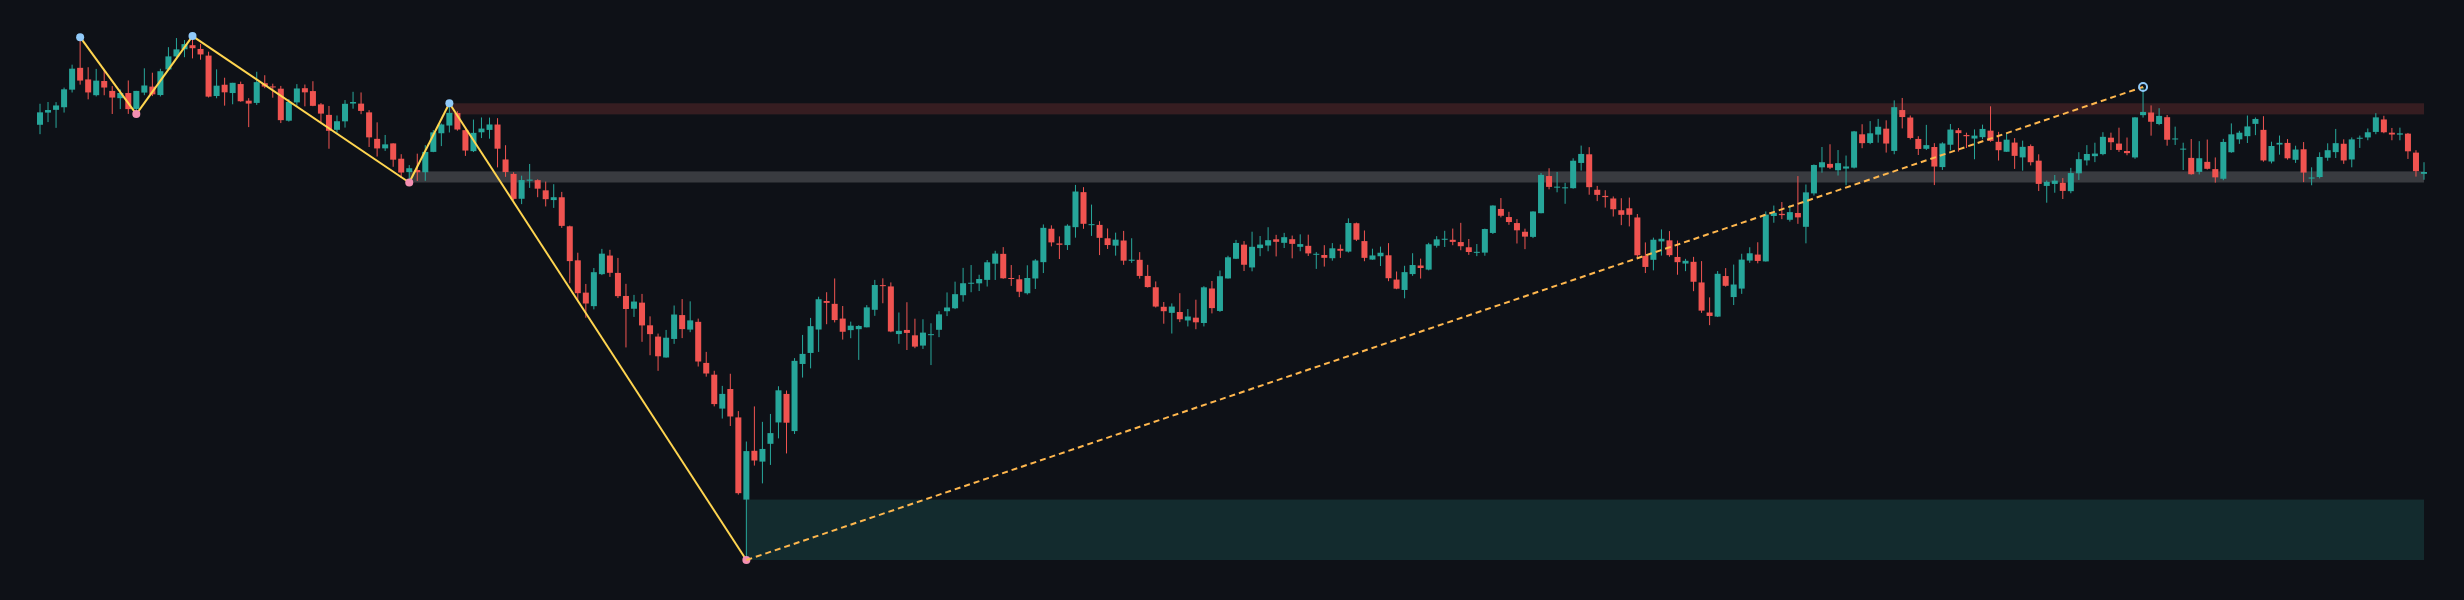
The weekly trend is down, while its sub-trend is up. The latest confirmed weekly swing is a low at 1.03535, and the report identifies no new weekly structure event. The last closed weekly price, 1.32378, sits within the reported broken-retest resistance zone at 1.31602–1.32423. That makes the area a key test: holding above it could support the weekly upswing, while renewed rejection would leave the dominant downtrend in control.
Broader weekly resistance is at 1.36666–1.37487, while weekly support is at 1.03535–1.08025. These zones are widely separated, so the nearer broken-retest area is more immediately relevant to the current structure. The report provides no weekly Fibonacci levels or moving-average readings, so those are not used here.
Main-frame structure
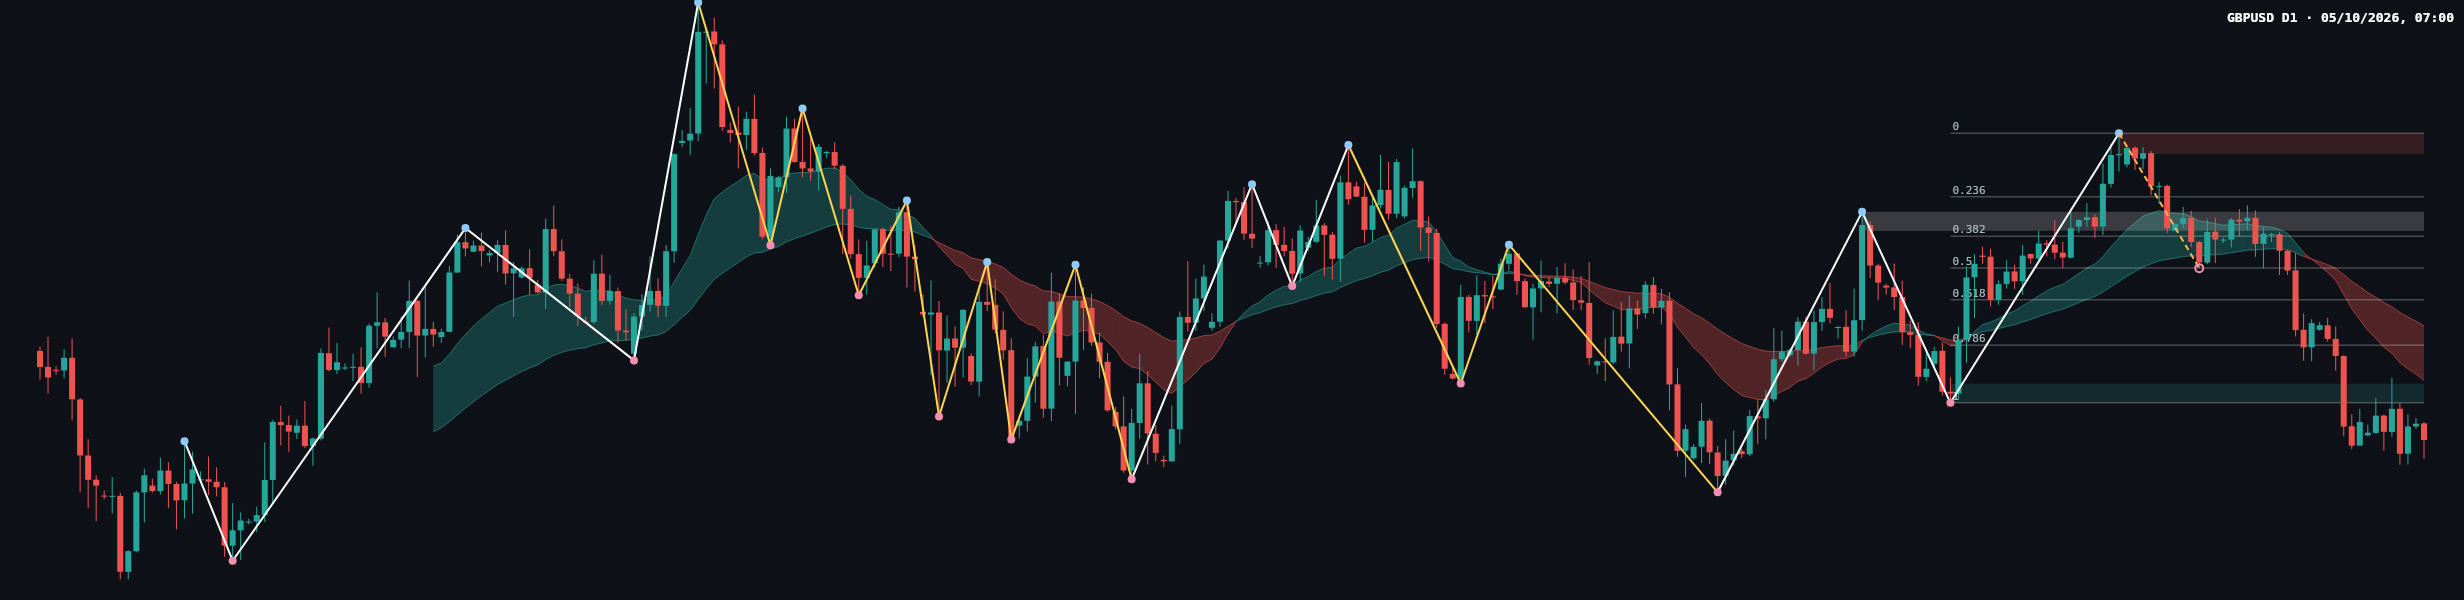
On the daily frame, the main trend is up but shaky and the sub-trend is down. A change of character is reported at 1.32730, and the latest close at 1.32176 is below that level. The chart therefore shows deterioration in the daily structure, even though the weekly sub-trend remains up.
The daily report lists 1.32730–1.33013 as support, but the close is beneath that zone, making it a level to watch for a possible reclaim or continued resistance. The separate broken-retest support zone at 1.35297–1.35580 is also above the latest close. The most recent confirmed daily swing is a high at 1.36754, within the reported resistance zone at 1.36441–1.36754.
The completed daily Fibonacci leg runs from 1.36754 to 1.32730. Its reported levels are 1.35804, 1.35217, 1.34742, 1.34267, and 1.33591, with the 1.000 level at 1.32730. The reported current retracement ratio is 1.000; price has moved below the leg’s 1.32730 endpoint, so a sustained reclaim would be needed to improve the immediate technical picture.
The chart depicts a sharp decline from the recent high followed by a modest, uneven attempt to stabilize. The supplied report does not describe the latest candle’s exact type, range, or wick proportions, nor does it provide volume or EMA values. Those details cannot be confirmed from the deterministic data, so the assessment rests on the reported close, structure, and zones rather than a specific candle pattern or indicator signal.
Key levels
- 1.32730–1.33013: daily zone above the latest close; a reclaim would be a first sign of recovery, while rejection would keep pressure on.
- 1.35297–1.35580: daily broken-retest support zone above price, relevant if the market recovers.
- 1.36441–1.36754: daily resistance, including the most recent confirmed swing high.
- 1.31602–1.32423: weekly broken-retest resistance zone, with the last weekly close inside it.
- 1.36666–1.37487: broader weekly resistance.
- 1.03535–1.08025: broader weekly support zone.
Scenarios
Bullish recovery: If price regains and holds above 1.32730–1.33013, the daily breakdown may prove less durable. The next listed zone to watch above is 1.35297–1.35580. A move back below 1.32730 would weaken this recovery scenario. No probability estimates are provided in the report.
Bearish continuation: If price remains below 1.32730–1.33013 and selling pressure persists, the daily change of character remains the dominant near-term signal. The broader weekly support zone at 1.03535–1.08025 is the next listed support area, though it is distant from current price and does not imply a direct or immediate move there. A sustained reclaim of 1.33013 would weaken this scenario.
Wider rebound: If buyers reclaim 1.35297–1.35580, attention could turn to daily resistance at 1.36441–1.36754. Failure to hold above 1.35297 would undermine that recovery case. These are conditional technical paths, not forecasts of certainty.
Closing view
The immediate balance leans cautious while GBPUSD remains below 1.32730–1.33013. A sustained reclaim would challenge the bearish daily signal; continued rejection would leave the weekly broken-retest area and the broader downtrend in focus.
This article is technical analysis for reference only, not investment advice. Markets involve risk, and readers are responsible for their own decisions.