
GBPUSD is at a short-term decision point: the latest daily close is 1.32640, below the 1.32730–1.33010 support zone. The weekly chart shows a recovery within a firm downtrend, while the daily chart’s shaky uptrend is under pressure after a bearish change of character at 1.32730.
Higher-timeframe context
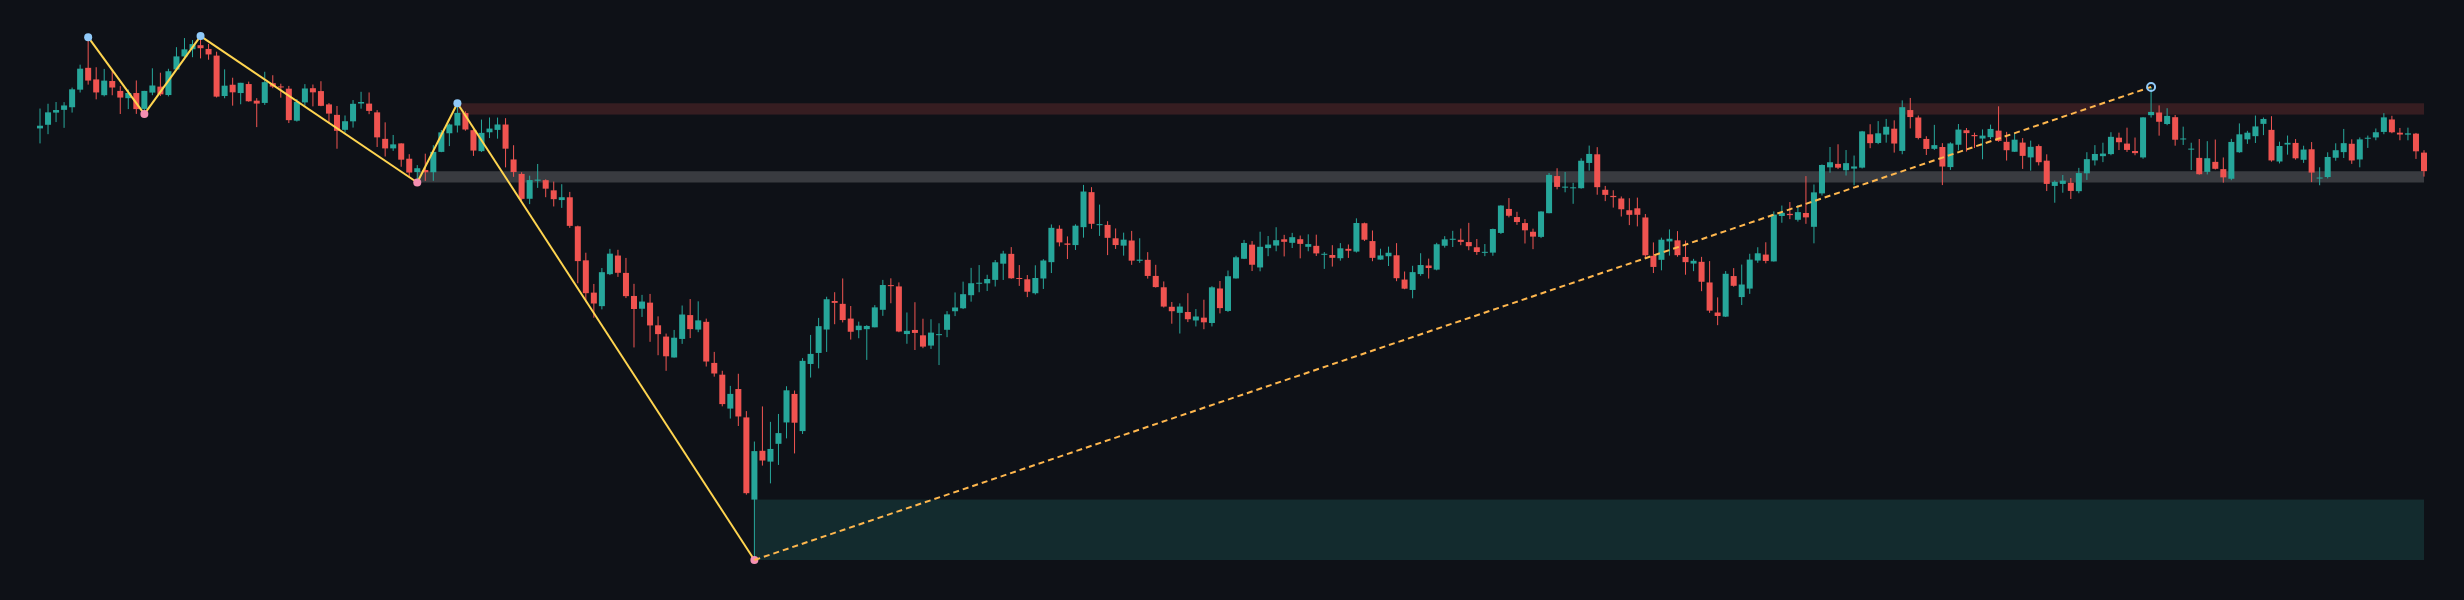
The weekly trend is firmly down, with an upward sub-trend following the confirmed swing low at 1.03535. No new weekly structure event is reported. Price at 1.32443 is just above the 1.31602–1.32436 broken-retest resistance zone, leaving that area important to monitor as potential support if it holds from above.
The broader weekly resistance zone is 1.36653–1.37487, while the marked support zone is 1.03535–1.08025. The weekly recovery offers scope for further repair, but the larger trend remains a headwind unless price can establish stronger structure. No weekly Fibonacci levels are provided in the report.
Main-frame structure
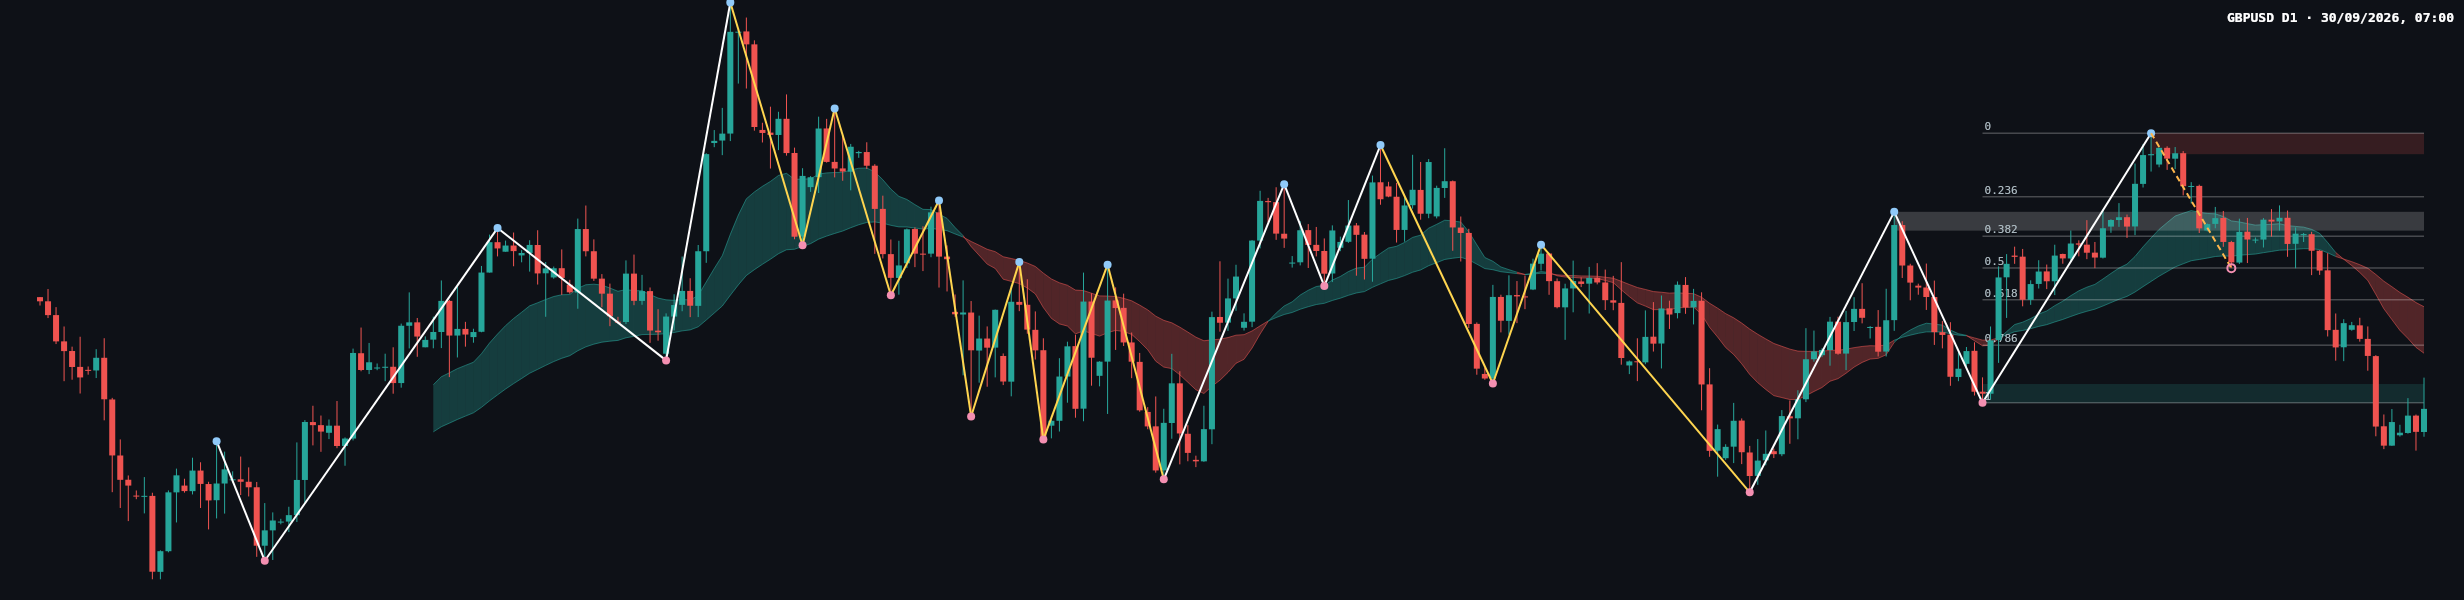
The daily main trend is up, but shaky, and its sub-trend is down. A change of character is recorded at 1.32730. The latest close, 1.32640, is below that broken level and below the 1.32730–1.33010 support zone, so the area now represents a key reclaim test rather than confirmed support.
The most recent confirmed daily swing is a high at 1.36754. The chart shows a retreat from that high and a sharp decline toward the lower end of the marked Fibonacci leg, followed by a modest rebound at the right edge. The report does not provide candle-by-candle measurements or EMA values, so neither a specific candle pattern nor the price’s position relative to the EMAs can be established from the permitted data.
The latest completed Dow leg has Fibonacci levels at 1.36754, 1.35804, 1.35217, 1.34742, 1.34267, 1.33591 and 1.32730. The current retracement ratio is 1.000, corresponding to 1.32730; the latest close is below that level. This leaves the daily structure vulnerable unless price can recover the nearby zone.
Key levels
| Area | Level | What it may indicate |
|---|---|---|
| Daily reclaim area | 1.32730–1.33010 | A recovery and hold could ease immediate downside pressure; continued rejection would keep the breakdown in focus. |
| Weekly broken-retest area | 1.31602–1.32436 | A weekly zone just beneath the latest weekly close; its behavior may help show whether the recovery is holding. |
| Daily broken-retest area | 1.35300–1.35580 | A higher area to watch if the daily recovery strengthens. |
| Daily resistance | 1.36441–1.36754 | Overhead resistance, including the most recent confirmed daily swing high. |
| Weekly resistance | 1.36653–1.37487 | A broader resistance zone on the weekly chart. |
| Weekly support | 1.03535–1.08025 | The marked weekly support zone, well below the current market area. |
Scenarios
- Bullish recovery: If price reclaims and holds above 1.32730–1.33010, the immediate breakdown would be challenged. The 1.35300–1.35580 area is a subsequent zone to monitor if recovery develops. A move back below 1.32730 would weaken this scenario.
- Bearish continuation: If price remains below 1.32730 or fails to hold a recovery into 1.32730–1.33010, downside pressure may persist, with the 1.31602–1.32436 weekly area in focus. A sustained recovery above 1.33010 would undermine this scenario.
- Upside extension: If price advances through 1.35300–1.35580 and holds above that area, attention could shift toward 1.36441–1.36754. A return below 1.35300 would weaken the extension case.
The near-term bias leans cautious while GBPUSD remains below 1.32730–1.33010; whether that zone is reclaimed or rejected is the key signal to watch.
This analysis is for information and reference only, not investment advice. Markets involve risk, and readers are responsible for their own decisions.