
GBPUSD is trading at 1.32539 on the daily frame after a sharp decline and a modest rebound. The weekly picture is still firmly down, despite an upward sub-trend, while the daily chart shows a shaky upward main trend, a downward sub-trend, and a change of character at 1.32730. The immediate question is whether price can reclaim the nearby daily zone at 1.32730 – 1.32998.
Higher-timeframe context
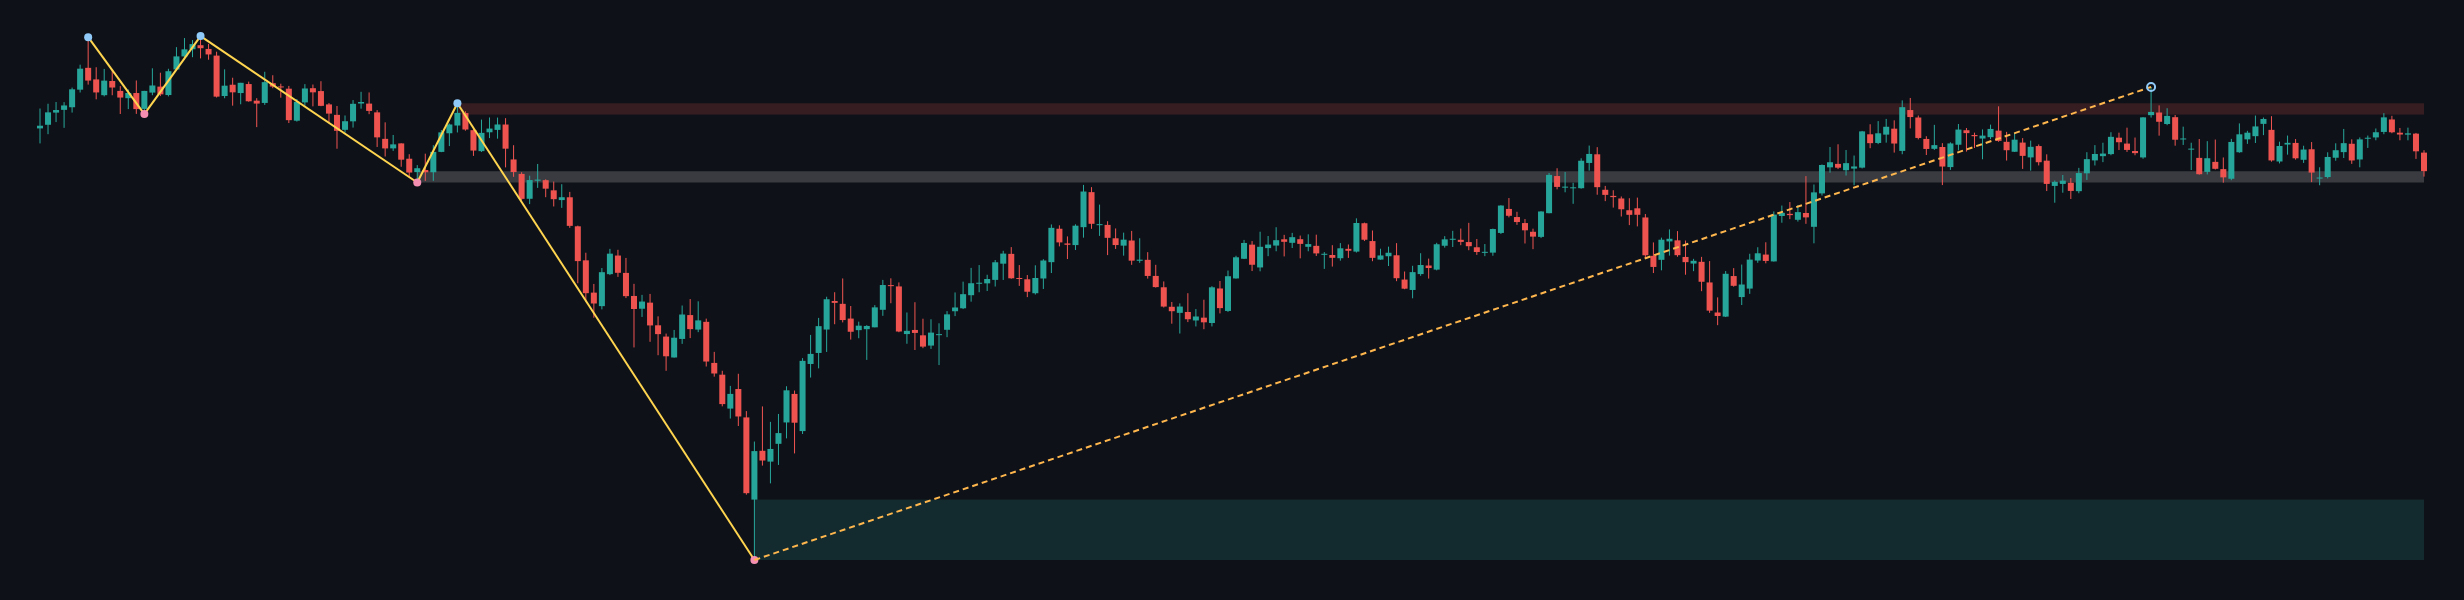
The weekly main trend is down, with an upward sub-trend. No new weekly structure event is reported. Price has moved just above the former resistance zone at 1.31602 – 1.32436, which is marked as a broken-retest area. Holding above that zone would help preserve the recovery, but the broader downtrend remains the dominant context. The higher weekly resistance zone is 1.36653 – 1.37487; the major support zone is 1.03535 – 1.08025.
The most recent confirmed weekly swing is a low at 1.03535. With the weekly trend still down, the current recovery is not, by itself, evidence that the longer-term direction has reversed.
Main-frame structure
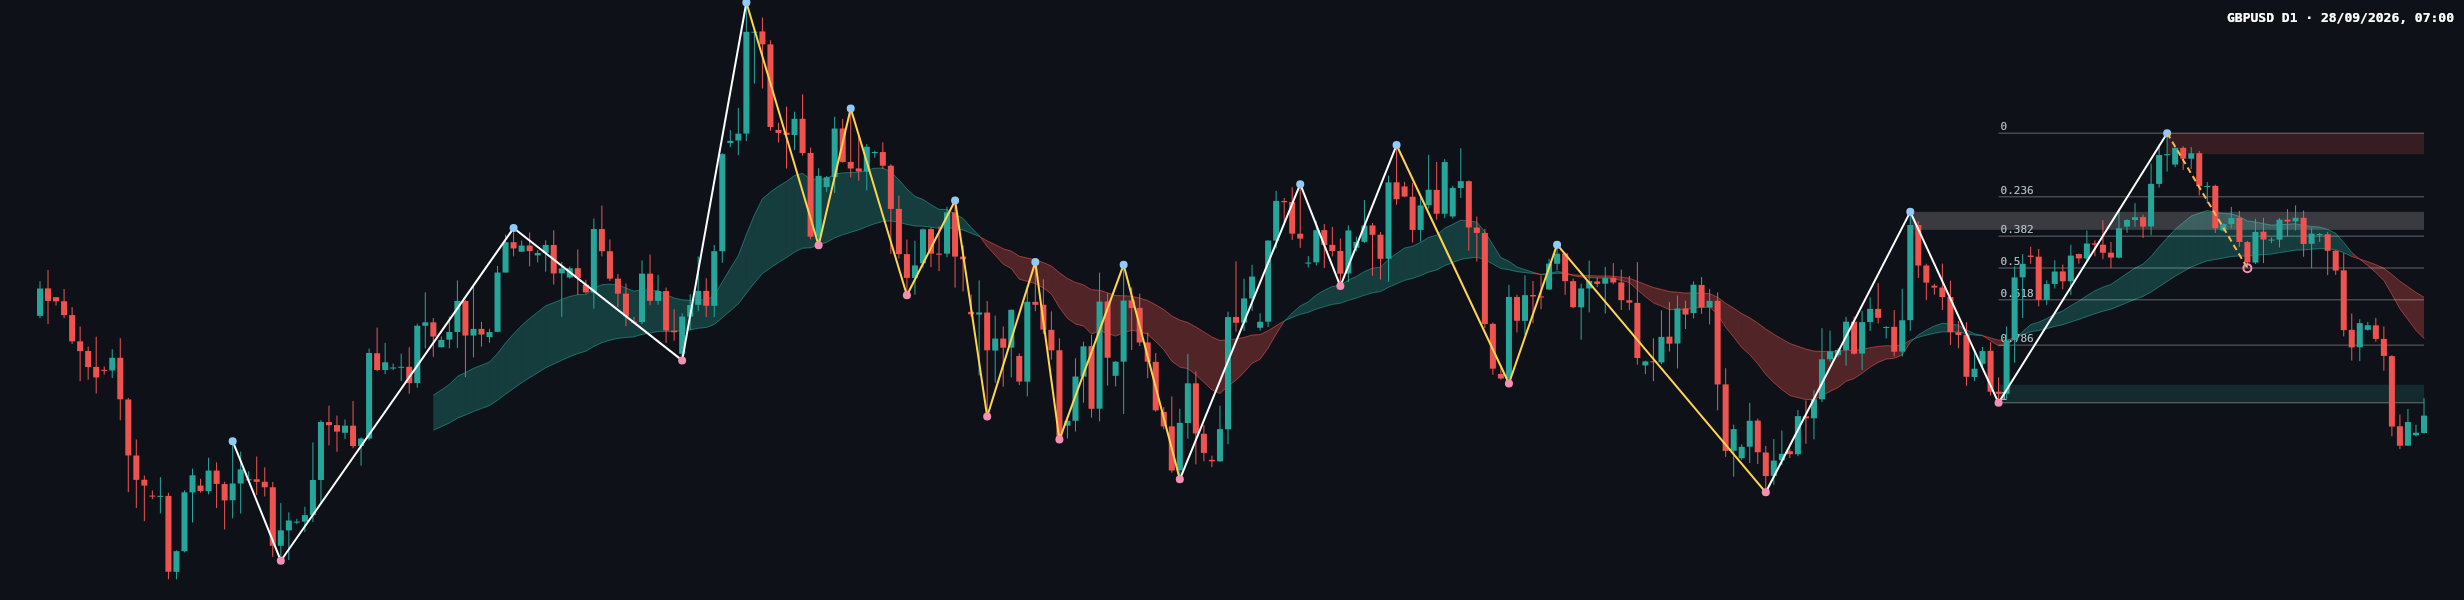
On the daily chart, the main trend is up but shaky, while the sub-trend is down. The reported change of character is tied to a break of 1.32730. The last closed price, 1.32539, is below the daily support zone at 1.32730 – 1.32998, so that zone is now an important reclaim test rather than confirmed support from the current price position.
The latest visible price action shows a pronounced downswing followed by a small rebound. That bounce has not yet erased the structural concern created by the break of 1.32730. The most recent confirmed daily swing is a high at 1.36754, which remains well above the current price.
The completed daily Fibonacci leg runs from 1.36754 to 1.32730. Its reported levels are 0 at 1.36754, 0.236 at 1.35804, 0.382 at 1.35217, 0.5 at 1.34742, 0.618 at 1.34267, 0.786 at 1.33591, and 1 at 1.32730. The current retracement ratio is 1.000, indicating price has reached the full-leg endpoint and is marginally below it at the reported close. A sustained recovery would need to regain nearby broken structure before the higher Fibonacci levels become relevant.
Key levels
| Area | Reported level | Why it matters |
|---|---|---|
| Near-term daily zone | 1.32730 – 1.32998 | Price is below this zone; reclaiming it would improve the recovery case. |
| Weekly broken-retest zone | 1.31602 – 1.32436 | The weekly close is just above this former resistance area. |
| Daily broken-retest zone | 1.35312 – 1.35580 | A higher resistance area if the daily recovery develops. |
| Daily resistance | 1.36441 – 1.36754 | Includes the most recent confirmed daily swing high. |
| Weekly resistance | 1.36653 – 1.37487 | Major overhead weekly supply area. |
| Weekly support | 1.03535 – 1.08025 | Major weekly support zone, distant from current price. |
Scenarios
Bullish recovery: If price reclaims and holds above 1.32730 – 1.32998, that would weaken the immediate bearish signal and open a conditional path toward the Fibonacci level at 1.33591, followed by 1.34267 if upward momentum persists. A renewed move below 1.32730 would undermine this scenario.
Bearish continuation: If price remains below 1.32730 – 1.32998 and selling resumes, the daily change of character would remain in force. The report does not identify a nearer downside target below the current price; the much lower weekly support zone is 1.03535 – 1.08025. A sustained reclaim and hold above 1.32998 would weaken this bearish case.
Range and failed-reclaim risk: Price may fluctuate around the boundary between the weekly broken-retest zone at 1.31602 – 1.32436 and the daily zone at 1.32730 – 1.32998. Repeated rejection below the daily zone would leave sellers with the structural advantage, while a sustained move back above it would make the immediate outlook less bearish.
Closing view
The weekly recovery is testing whether it can hold above former resistance, but the daily chart remains vulnerable while GBPUSD is below 1.32730 – 1.32998. A reclaim would improve the bullish case; continued rejection beneath that zone would keep the bearish change of character relevant. The key signal is how price behaves around this boundary, rather than assuming the recent bounce has settled the direction.
#GBPUSD #Forex #TechnicalAnalysis #PriceAction #DailyChart
Meta description: GBPUSD daily analysis: weekly recovery meets a bearish daily structure, with 1.32730–1.32998 the key reclaim zone.
This article is technical analysis for reference only and is not investment advice. Markets carry risk, and readers are responsible for their own decisions.