
GBPUSD closed at 1.35254. The daily chart still carries a firm upward trend, while its sub-trend is down and the latest move is testing an important cluster around the 0.382 Fibonacci level at 1.35217 and the daily broken-retest support zone at 1.35334 – 1.35580. The broader weekly trend remains firmly down, so the market is balancing a daily recovery against higher-timeframe resistance.
Higher-timeframe context: Weekly
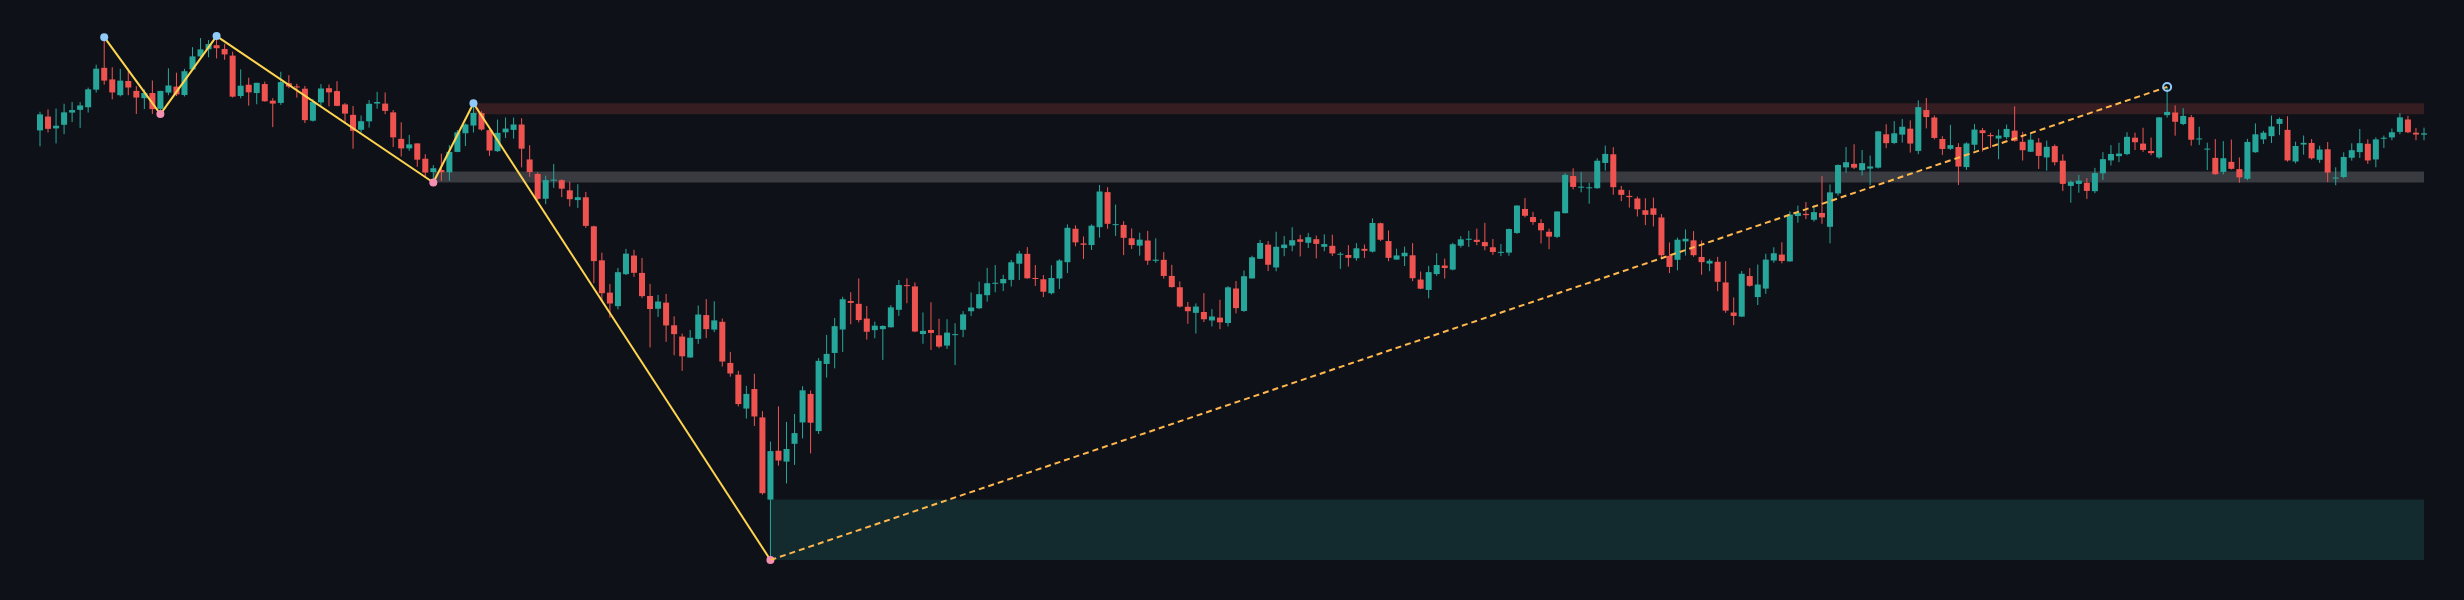
The weekly trend is down and firm, although the sub-trend is up. The most recent confirmed weekly swing is a low at 1.03535, and no weekly structure event is reported. This means the recovery has not yet produced a confirmed change in the dominant weekly direction.
Price is below the weekly resistance zone at 1.36675 – 1.37487, which remains the principal higher-timeframe supply area visible in the report. A second weekly zone at 1.31602 – 1.32414 is marked as broken-retest support. The wider weekly support zone is 1.03535 – 1.08025. The weekly ATR is 0.01624, indicating a broader range framework than the daily ATR of 0.00493.
The weekly chart therefore permits further recovery while price remains above the broken-retest area at 1.31602 – 1.32414, but the downtrend remains the governing context while the market stays beneath 1.36675 – 1.37487. The current close is near the upper part of that weekly structure, rather than in open space.
Main-frame structure: Daily
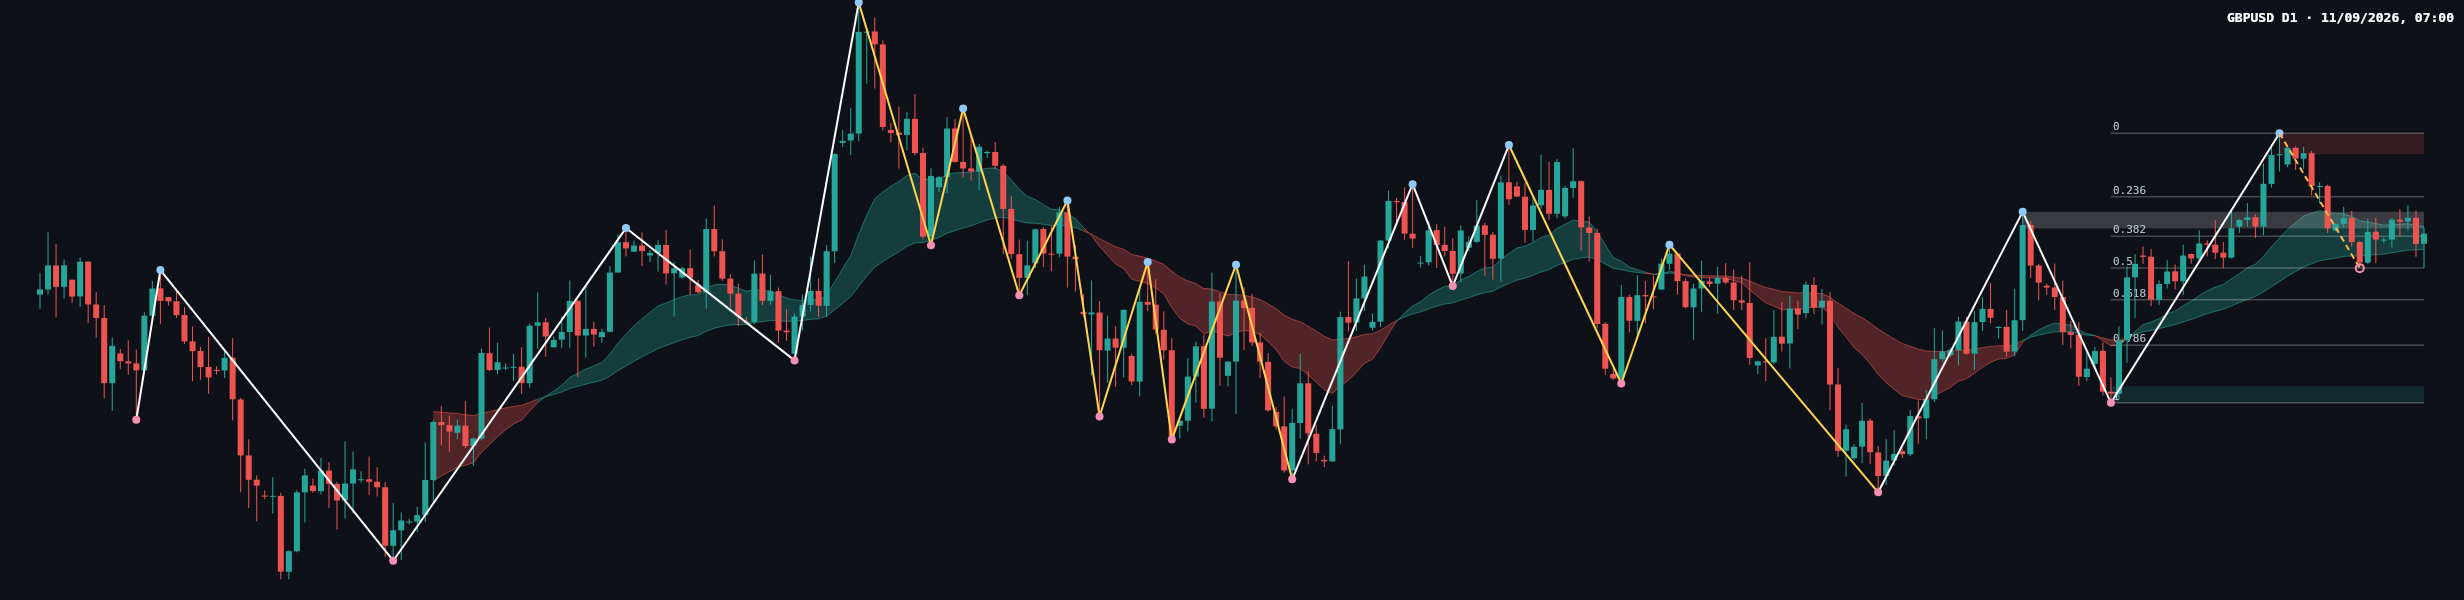
The daily trend is up and firm, but the sub-trend is down. This is a misalignment with the weekly chart and can be read as a pullback within the daily advance, unless the nearby support structure fails. No daily structure event is reported. The most recent confirmed daily swing is a high at 1.36754.
The closest daily resistance zone is 1.36441 – 1.36754. The main support zone is 1.32730 – 1.32976, while the broken-retest zone is 1.35334 – 1.35580. With the last close at 1.35254, price is sitting just beneath the broken-retest band and close to the 0.382 Fibonacci level at 1.35217.
The latest completed Dow leg defines Fibonacci levels at 0: 1.36754, 0.236: 1.35804, 0.382: 1.35217, 0.5: 1.34742, 0.618: 1.34267, 0.786: 1.33591, and 1: 1.32730. The current retracement ratio is 0.373, placing the market close to the 0.382 level. That level remains technically relevant while the daily swing high at 1.36754 remains intact.
The recent candles show hesitation around the retracement area rather than a clean directional continuation. The chart displays alternating bullish and bearish bodies, with rejection on both sides and price moving around the moving-average ribbon. Sellers have been able to press price back from the daily resistance area, but buyers have not yet lost the broader daily support structure. Volume is not provided in the deterministic report, so volume confirmation or divergence is not determinable here.
Key levels and candle interpretation
The most recent closing candle should be treated as a warning of short-term uncertainty rather than a confirmed reversal. Its position near 1.35254, the 0.382 level at 1.35217, and the broken-retest zone at 1.35334 – 1.35580 places the close at a decision area. The surrounding price action suggests that sellers have controlled the latest pullback, while buyers are still defending the broader daily advance.
- Nearest resistance: the broken-retest zone at 1.35334 – 1.35580, followed by the Fibonacci level at 1.35804.
- Major resistance: the daily zone at 1.36441 – 1.36754 and the weekly zone at 1.36675 – 1.37487.
- Nearest Fibonacci support: 1.35217.
- Lower Fibonacci references: 1.34742, 1.34267, 1.33591, and 1.32730.
- Main daily support: 1.32730 – 1.32976.
No separate psychological pivot is supplied in the deterministic report. The most useful confirmation area is therefore the interaction between 1.35217 and 1.35334 – 1.35580.
Conditional scenarios
Primary scenario: recovery through the broken-retest zone
If price reclaims and holds above 1.35334 – 1.35580, while remaining supported by 1.35217, the daily uptrend would regain short-term control. The next upside reference would be 1.35804, followed by the resistance area at 1.36441 – 1.36754. This is the higher-probability scenario while the daily support structure remains intact. A sustained move below 1.34742 would invalidate this recovery interpretation.
Secondary scenario: deeper daily retracement
If price remains below 1.35334 – 1.35580 and breaks beneath 1.35217, the pullback could extend toward 1.34742 and then 1.34267. This would weaken the immediate daily structure without, by itself, removing the broader daily uptrend. A recovery above 1.35804 would weaken this bearish continuation scenario.
Risk scenario: upside test of the weekly supply area
If price breaks above the daily swing high at 1.36754, the market could test the weekly resistance zone at 1.36675 – 1.37487. That would represent a stronger challenge to the weekly downtrend, but not a confirmed weekly reversal because no weekly structure event has been reported. A return below 1.36441 would invalidate the immediate breakout interpretation.
What to monitor
- Watch whether 1.35217 acts as support or whether the close remains below it.
- Monitor the reaction to 1.35334 – 1.35580, the key broken-retest area.
- Above 1.35804, attention shifts toward 1.36441 – 1.36754.
- Below 1.34742, the next Fibonacci references are 1.34267 and 1.33591.
- False breaks are possible where the daily and weekly zones overlap. A close followed by a retest would provide stronger confirmation than a brief intraday move.
Broader drivers such as the dollar, bond yields, scheduled economic releases, central-bank communication, and geopolitical headlines can alter the technical picture quickly. Readers should also account for the daily ATR of 0.00493 and the weekly ATR of 0.01624 when assessing expected movement, without treating either measure as a forecast.
Closing view
GBPUSD is at a pivotal daily retracement area. The daily trend favors a recovery if 1.35217 holds and price reclaims 1.35334 – 1.35580, while the weekly downtrend keeps the resistance band at 1.36675 – 1.37487 important. Until one side establishes a clear close beyond these reference zones, a two-way reaction remains the most measured interpretation.
Hashtags: #GBPUSD #Forex #PriceAction #DowTheory #TechnicalAnalysis
Meta description: GBPUSD daily analysis: price tests 1.35217 and 1.35334–1.35580 while weekly resistance remains at 1.36675–1.37487.
This article is technical analysis for reference only, not investment advice. Markets carry risk, and readers are responsible for their own decisions.