
GBPUSD presents a mixed multi-timeframe picture. The Weekly chart remains in a firm downtrend, although its sub-trend is up, while the D1 chart shows a firm uptrend and a confirmed break of 1.35580. The latest closed prices are 1.36441 on W1 and 1.35962 on D1, placing the pair close to an important higher-timeframe resistance zone.
Higher-timeframe context: W1
The primary Weekly trend is down, with the sub-trend moving up. No new Weekly structure event is reported, and the most recent confirmed swing is a low at 1.03535. This means the current advance is constructive on the lower timeframe but has not yet overturned the broader Weekly direction.
At 1.36441, the Weekly close sits just below the 1.36602–1.37487 resistance zone. That area is therefore the main higher-timeframe test. A sustained move through it would improve the case that the sub-trend is developing into a broader recovery. Failure to overcome the zone would leave the larger downtrend intact.
The broken-retest resistance zone at 1.31602–1.32487 is below current price and may become relevant if the advance loses momentum. The wider Weekly support zone is 1.03535–1.08025, aligned with the most recent confirmed swing low at 1.03535. The Weekly ATR is 0.01770, indicating that the broader chart has materially wider movement potential than the D1 framework.
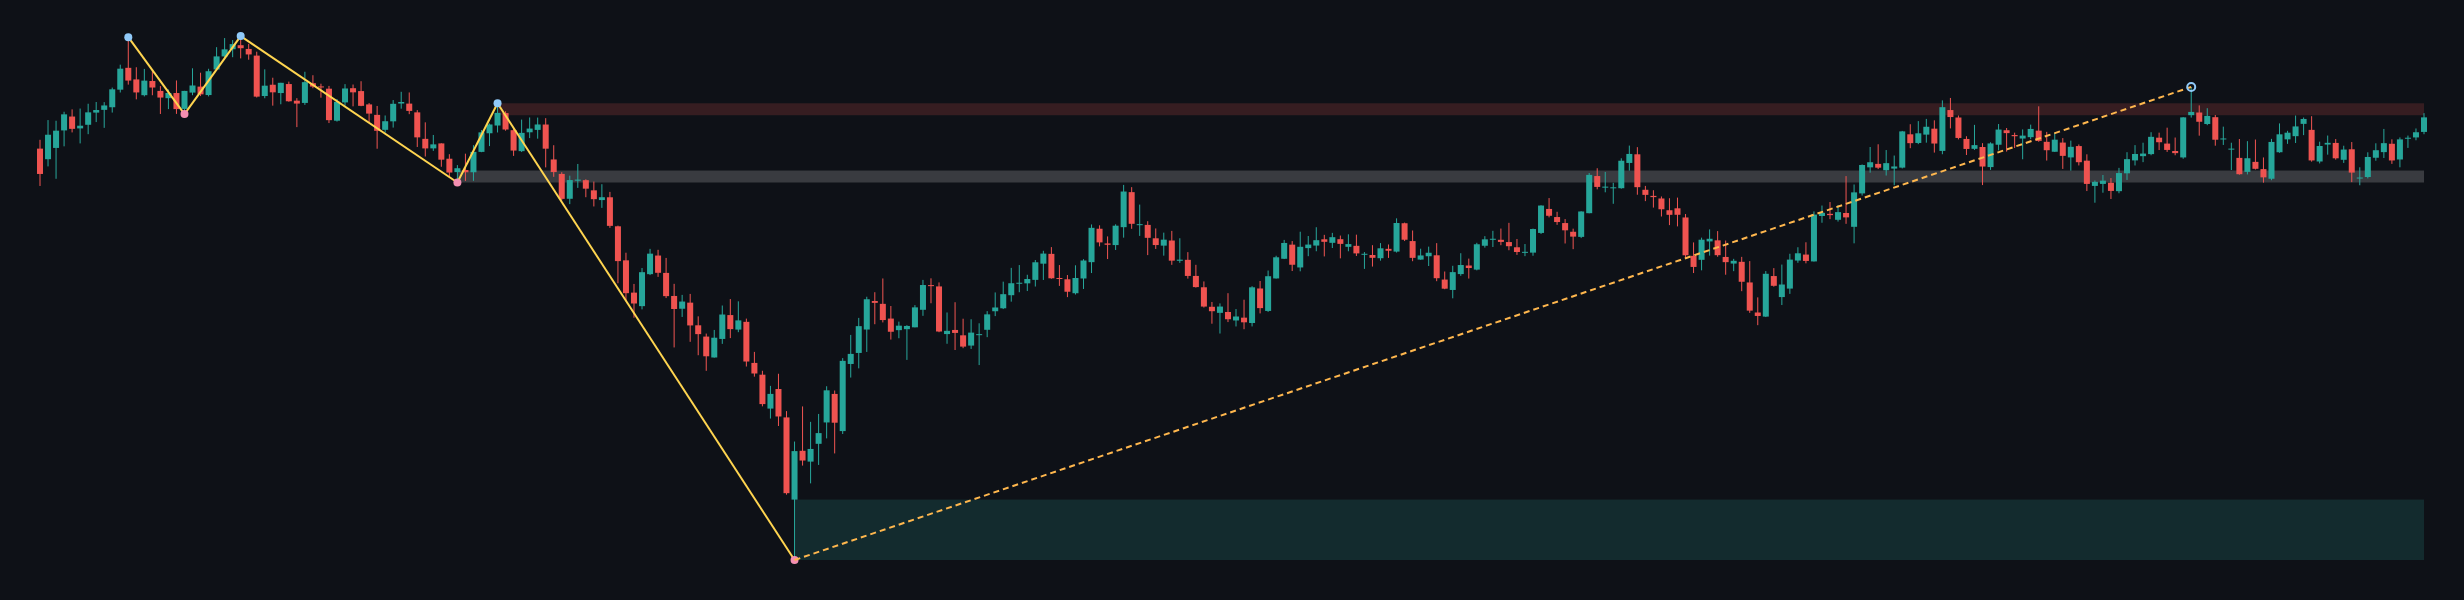
The Weekly report does not provide EMA values or a Weekly Fibonacci reading, so the price relationship to those tools is not determinable from the deterministic data. The higher timeframe permits further upside while price remains supported, but it favors caution near 1.36602–1.37487.
Main-frame structure: D1
The D1 trend is up and the sub-trend is also up, aligning with the upward Weekly sub-trend but not with the firm Weekly primary trend. The key structure event is a BOS through 1.35580. The latest D1 close at 1.35962 remains above the broken level, so the bullish structure is still active in the reported data.
The nearest D1 resistance zone is 1.35313–1.35580. Because the BOS level is the upper boundary of that zone, the area can be treated as a broken-resistance and retest reference. The support zone at 1.34823–1.35090 is also marked as broken-retest support, while the broader D1 support zone is 1.32730–1.32997. The most recent confirmed D1 swing is a low at 1.32730.
The latest completed Dow leg runs from 1.32730 to 1.35580. Its reported Fibonacci levels are 0 at 1.32730, 0.236 at 1.33403, 0.382 at 1.33819, 0.5 at 1.34155, 0.618 at 1.34491, 0.786 at 1.34970, and 1 at 1.35580. The current retracement ratio is 1.000, placing the reported reading at the completed-leg extreme rather than within a lower retracement band.
The D1 ATR is 0.00535. The chart shows price holding above the rising coloured average zone after the recent advance, but the deterministic report does not provide EMA values, crossover data, or exact spacing. Those details are therefore not determinable numerically.
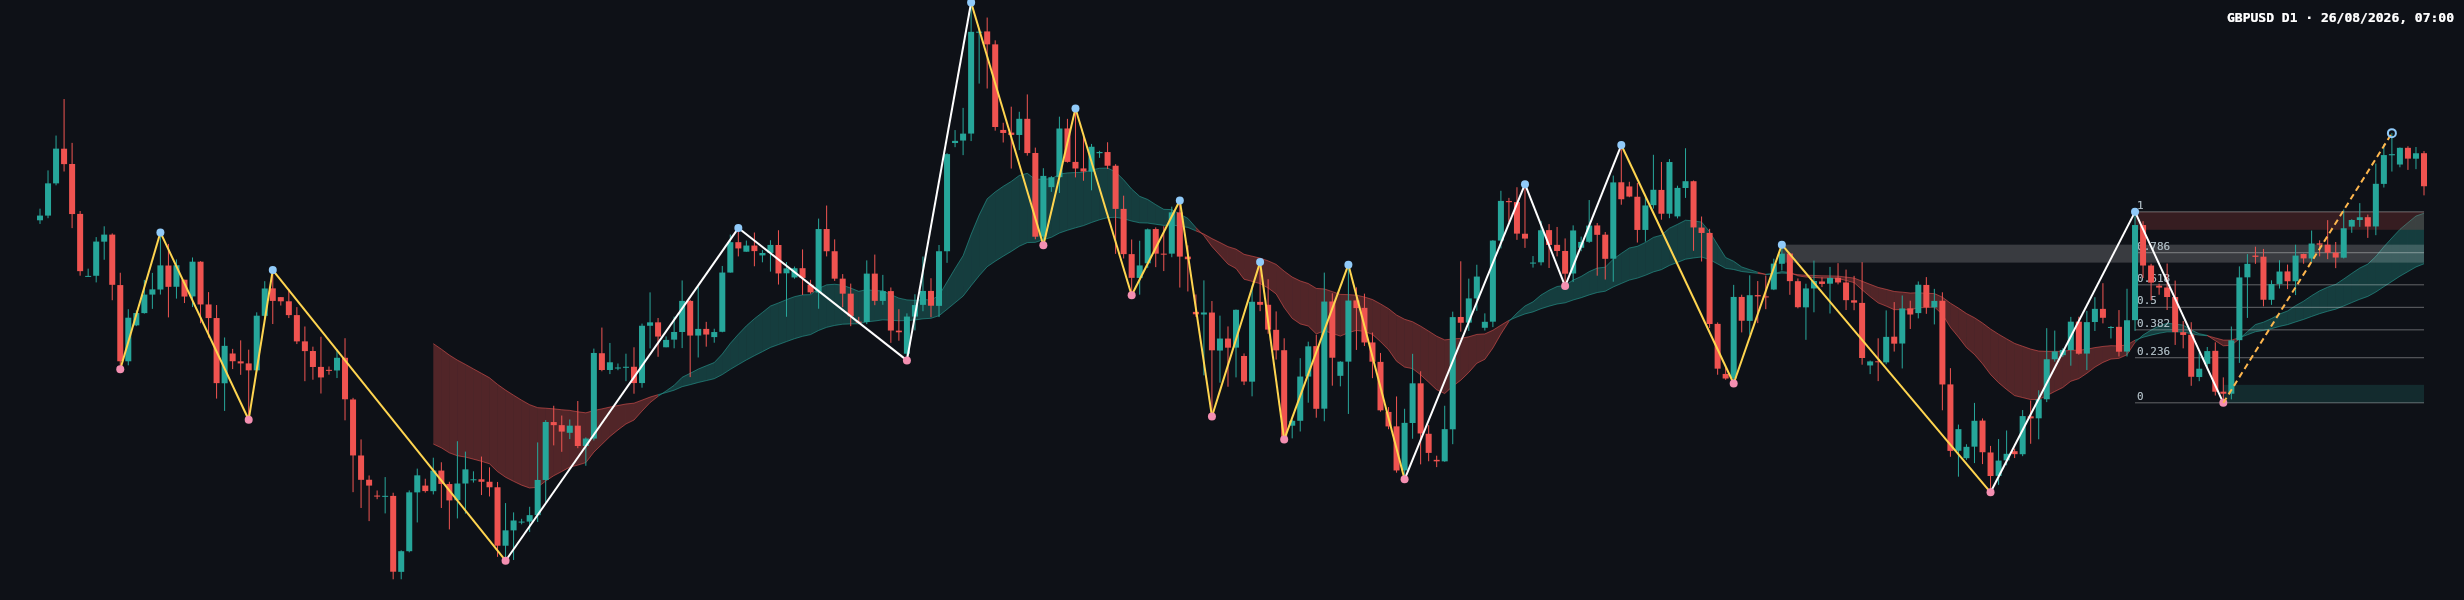
The D1 conclusion is conditionally bullish above the broken level at 1.35580, but the signal is approaching Weekly resistance at 1.36602–1.37487. A failure to hold the broken-retest areas would weaken the immediate bullish structure.
Key levels
| Reference | Level or zone | Interpretation |
|---|---|---|
| Weekly resistance | 1.36602–1.37487 | Primary higher-timeframe supply test |
| Weekly broken-retest resistance | 1.31602–1.32487 | Lower resistance reference if the broader structure weakens |
| D1 resistance and BOS level | 1.35313–1.35580 | Structure-break area and nearby retest reference |
| D1 broken-retest support | 1.34823–1.35090 | First support area beneath the current close |
| D1 broader support | 1.32730–1.32997 | Major D1 demand reference |
| Latest D1 close | 1.35962 | Above the reported BOS level |
Scenarios
Bullish continuation
If D1 price holds above 1.35580 and then breaks through the Weekly resistance zone at 1.36602–1.37487, the next directional phase would favor continuation of the rising D1 sub-trend. The invalidation condition for this interpretation is a loss of 1.35580, followed by sustained weakness into 1.34823–1.35090.
Range or resistance rejection
If price remains below 1.36602–1.37487 while holding above 1.35313–1.35580, consolidation between the D1 structure area and Weekly supply becomes the balanced scenario. This would preserve the D1 bullish structure without confirming a Weekly reversal. The scenario is weakened by a decisive move below 1.35313.
Bearish reversal risk
If price breaks below 1.35313 and cannot reclaim 1.35580, sellers would have evidence that the recent BOS has failed. The next downside reference would be the broken-retest support at 1.34823–1.35090, with the broader D1 support zone at 1.32730–1.32997 becoming relevant if weakness persists. The bearish interpretation is invalidated by a sustained recovery above 1.36602–1.37487.
Overall, the D1 bias leans upward above 1.35580, while the Weekly resistance zone at 1.36602–1.37487 limits the strength of that bias.
Closing view
- The Weekly primary trend is down, despite an upward sub-trend.
- The D1 trend is up, with a BOS through 1.35580.
- The immediate upside test is 1.36602–1.37487.
- The first important downside references are 1.35313–1.35580 and 1.34823–1.35090.
- The single most important condition is whether price can remain above 1.35580 while confronting Weekly supply.
Meta description: GBPUSD holds a D1 bullish structure above 1.35580 but faces Weekly resistance at 1.36602–1.37487.
This article is technical analysis and reference information only, not investment advice. Markets carry risk, and readers are responsible for their own decisions.