
GBPUSD is consolidating near the upper boundary of its daily range. The last closed price is 1.35360 on the daily frame, while the weekly last closed price is 1.35335. Price is pressing into the daily resistance zone at 1.35315 – 1.35580, making acceptance above that area or rejection back toward support the key developments to monitor.
| Metric | Value |
|---|---|
| Weekly last closed price | 1.35335 |
| Daily last closed price | 1.35360 |
| Weekly trend | Down, with an upward sub-trend |
| Daily trend | Sideways |
| Nearest resistance | 1.35315 – 1.35580 |
| Nearest support | 1.34825 – 1.35090 |
| Active Fibonacci reading | Current retracement ratio 0.053 |
| Daily ATR | 0.00531 |
Higher-timeframe context
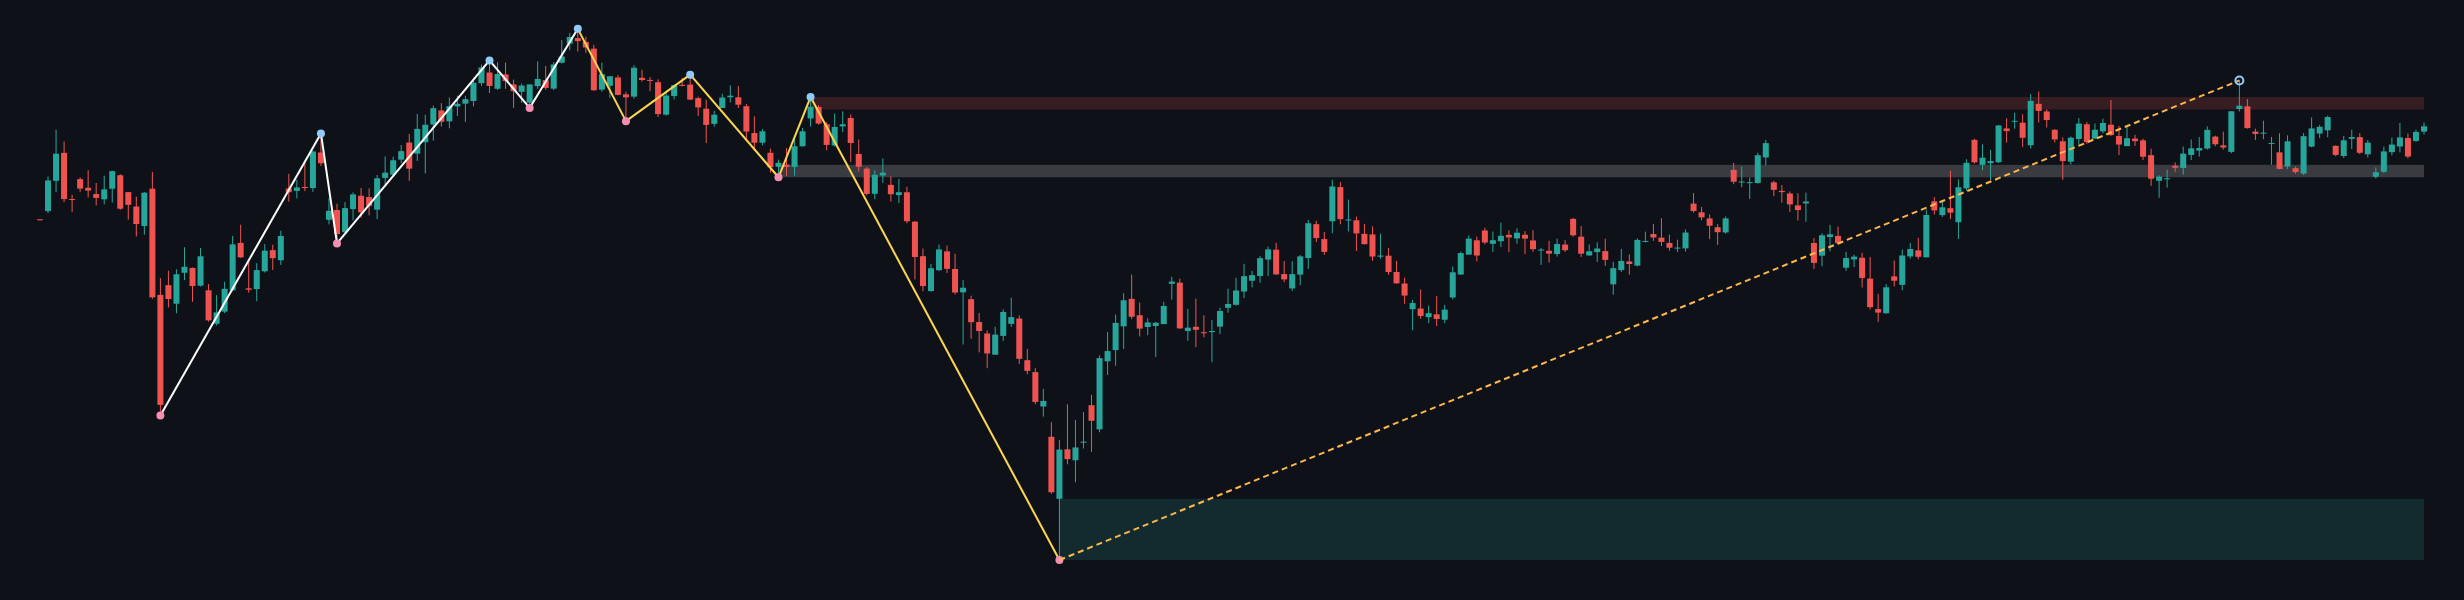
The weekly main trend remains down and is described as firm, although the sub-trend is up. The most recent confirmed weekly swing is a low at 1.03535, and the report identifies no weekly structure event. This combination permits a continued corrective advance, but it does not yet establish a confirmed reversal of the broader downtrend.
Weekly resistance is located at 1.36575 – 1.37487. A further weekly resistance area at 1.31602 – 1.32514 is marked as a broken-retest zone, while the major weekly support zone is 1.03535 – 1.08025. The weekly ATR is 0.01825. Weekly EMA positioning, spacing and crossover status are not determinable from the deterministic report.
From a multi-timeframe perspective, the upward weekly sub-trend supports the possibility of additional recovery toward 1.36575 – 1.37487. However, the firm weekly downtrend means that failure to hold the daily resistance area could keep the advance within a corrective structure.
Main-frame structure
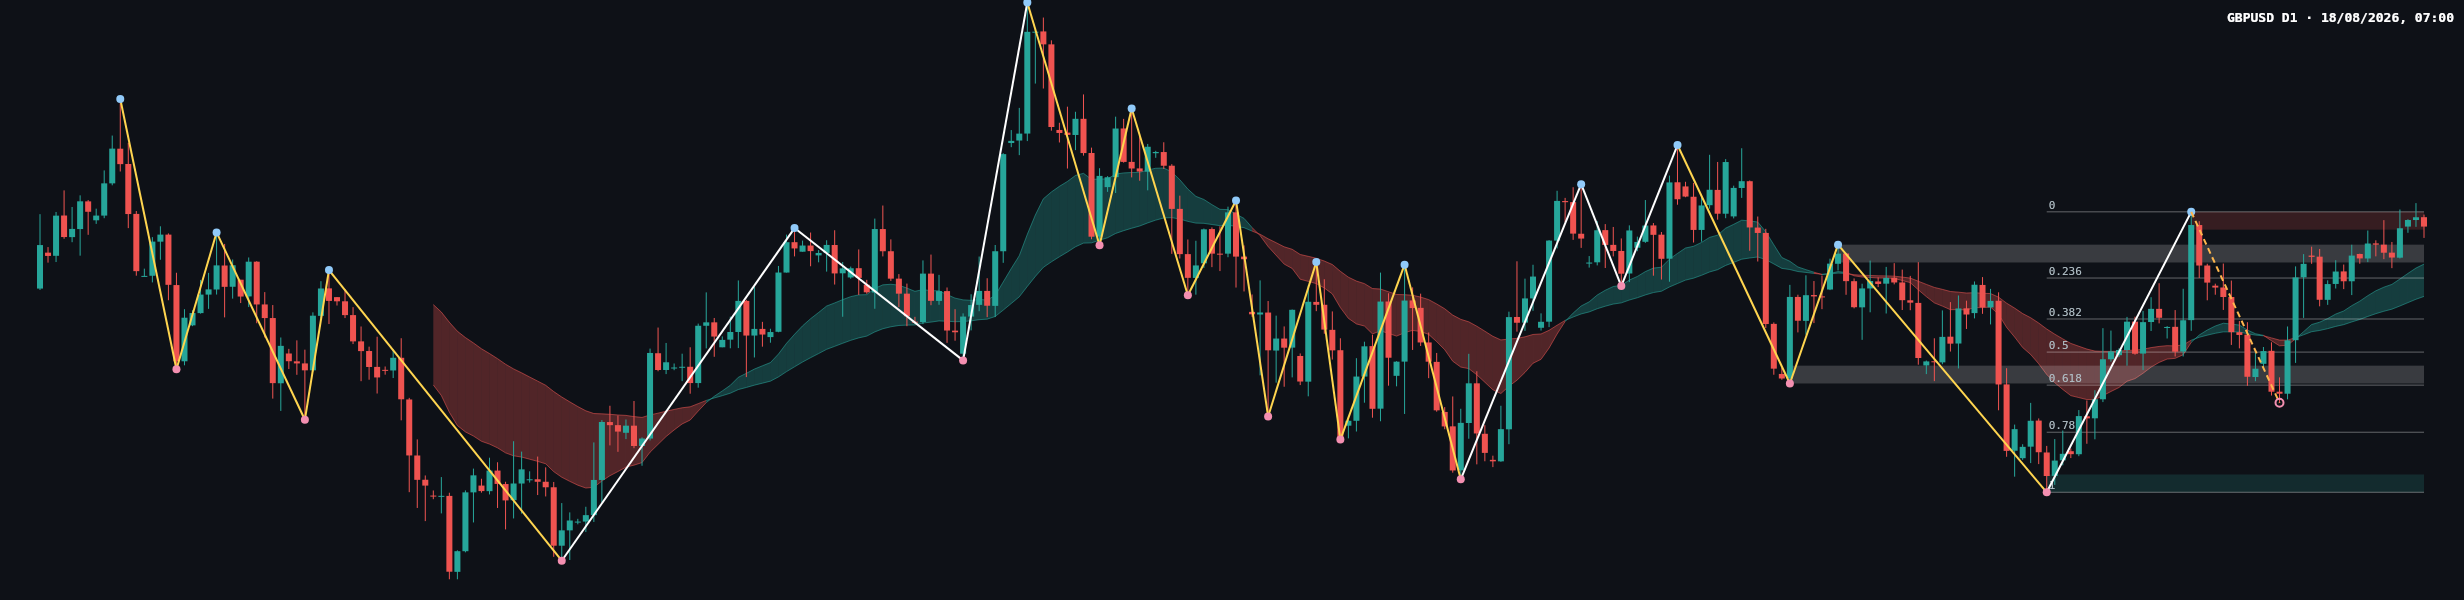
The daily main trend and sub-trend are both sideways, so the daily chart is not currently aligned with the weekly directional trend. The daily range is bounded most clearly by resistance at 1.35315 – 1.35580 and support at 1.34825 – 1.35090. The most recent confirmed daily swing is a high at 1.35580, and no daily structure event is reported.
Additional daily support is found at 1.31395 – 1.31660. Resistance at 1.33019 – 1.33284 is identified as a broken-retest zone. The latest completed Dow leg has Fibonacci levels at 0: 1.35580, 0.236: 1.34592, 0.382: 1.33981, 0.5: 1.33487, 0.618: 1.32994, 0.786: 1.32291 and 1: 1.31395. The current retracement ratio is 0.053, placing price close to the upper endpoint of that latest leg.
The daily chart shows price interacting with the upper portion of the latest Fibonacci structure, close to 0: 1.35580. A sustained move above the daily resistance zone would improve the short-term bullish case, while rejection would preserve the range interpretation and expose the broken-retest support at 1.34825 – 1.35090.
Key levels and recent price action
The primary decision area is 1.35315 – 1.35580. The upper boundary is also the most recent confirmed daily swing high, so a failure there would be consistent with continued sideways trade. A clean acceptance above the zone would instead represent a meaningful test of the current range ceiling, with the weekly resistance zone at 1.36575 – 1.37487 becoming the next broader area of interest.
Below the market, the first support area is 1.34825 – 1.35090. A break and failure to recover that zone would weaken the immediate bullish structure and bring the lower daily support at 1.31395 – 1.31660 into the wider bearish scenario. The Fibonacci levels at 0.236: 1.34592 and 0.382: 1.33981 provide intermediate reference points if the pullback extends.
The latest candles show a recovery toward the upper boundary after price traded around the middle and lower portions of the daily range. The most recent candle appears relatively contained rather than a decisive wide-range expansion candle, and it closes close to the resistance area. That suggests buyers have retained short-term pressure, but the proximity of 1.35580 means sellers have not yet been conclusively displaced.
EMA20 and EMA50 values, their slopes, spacing and crossover condition are not determinable from the report. Volume and momentum readings are also not supplied, so they cannot be used as confirmation.
Scenarios
Bullish continuation
If daily price closes above 1.35580 and holds above the resistance zone at 1.35315 – 1.35580, the bullish scenario would gain confirmation. The next higher-timeframe area to observe would be 1.36575 – 1.37487. This scenario would be invalidated if price returned below 1.35315 and failed to reclaim the broken resistance area.
Range continuation
If price remains below 1.35580 while holding above 1.34825 – 1.35090, the sideways interpretation remains dominant. In that case, the market could continue rotating between the daily resistance and support zones. This scenario would be weakened by a confirmed daily close outside either boundary.
Bearish rejection
If price is rejected from 1.35315 – 1.35580 and then breaks below 1.34825 – 1.35090, sellers would have evidence that the upper boundary remains active. The next downside references would be 1.34592, 1.33981 and the broader support zone at 1.31395 – 1.31660. This scenario would be invalidated by renewed acceptance above 1.35580.
Probability percentages are not provided in the deterministic data, so the scenarios are ranked qualitatively rather than assigned numerical probabilities. The current daily bias is neutral until price either accepts above 1.35580 or loses 1.34825 – 1.35090.
Closing view
- The weekly trend remains firmly down, but its sub-trend is up.
- The daily structure is sideways and is currently testing 1.35315 – 1.35580.
- Acceptance above 1.35580 would shift attention toward 1.36575 – 1.37487.
- Rejection followed by a break below 1.34825 – 1.35090 would strengthen the bearish case.
- The most important issue is whether price can establish acceptance beyond the daily range boundary rather than merely probe it.
#GBPUSD #Forex #PriceAction #DowTheory #TechnicalAnalysis
Meta description: GBPUSD remains range-bound near daily resistance, with bullish and bearish scenarios defined by the key support and resistance zones.
This article is technical analysis and reference information only, not investment advice. Markets carry risk, and readers are responsible for their own decisions.