
GBPUSD is balancing between a firm upward weekly trend and a sideways daily structure with a downward sub-trend. The latest daily close is 1.35107, just above the daily broken-retest support zone at 1.34781–1.35090 and below resistance at 1.35271–1.35580. This places the pair in a narrow decision area where acceptance above resistance would improve the bullish case, while renewed pressure below support would expose lower Fibonacci levels.
| Metric | Reading |
|---|---|
| Weekly last closed price | 1.34927 |
| Daily last closed price | 1.35107 |
| Weekly trend | Up, firm; sub-trend down |
| Daily trend | Sideways, firm; sub-trend down |
| Nearest daily resistance | 1.35271–1.35580 |
| Nearest daily support | 1.34781–1.35090 |
| Active Fibonacci retracement | 0.113 |
Higher-timeframe context
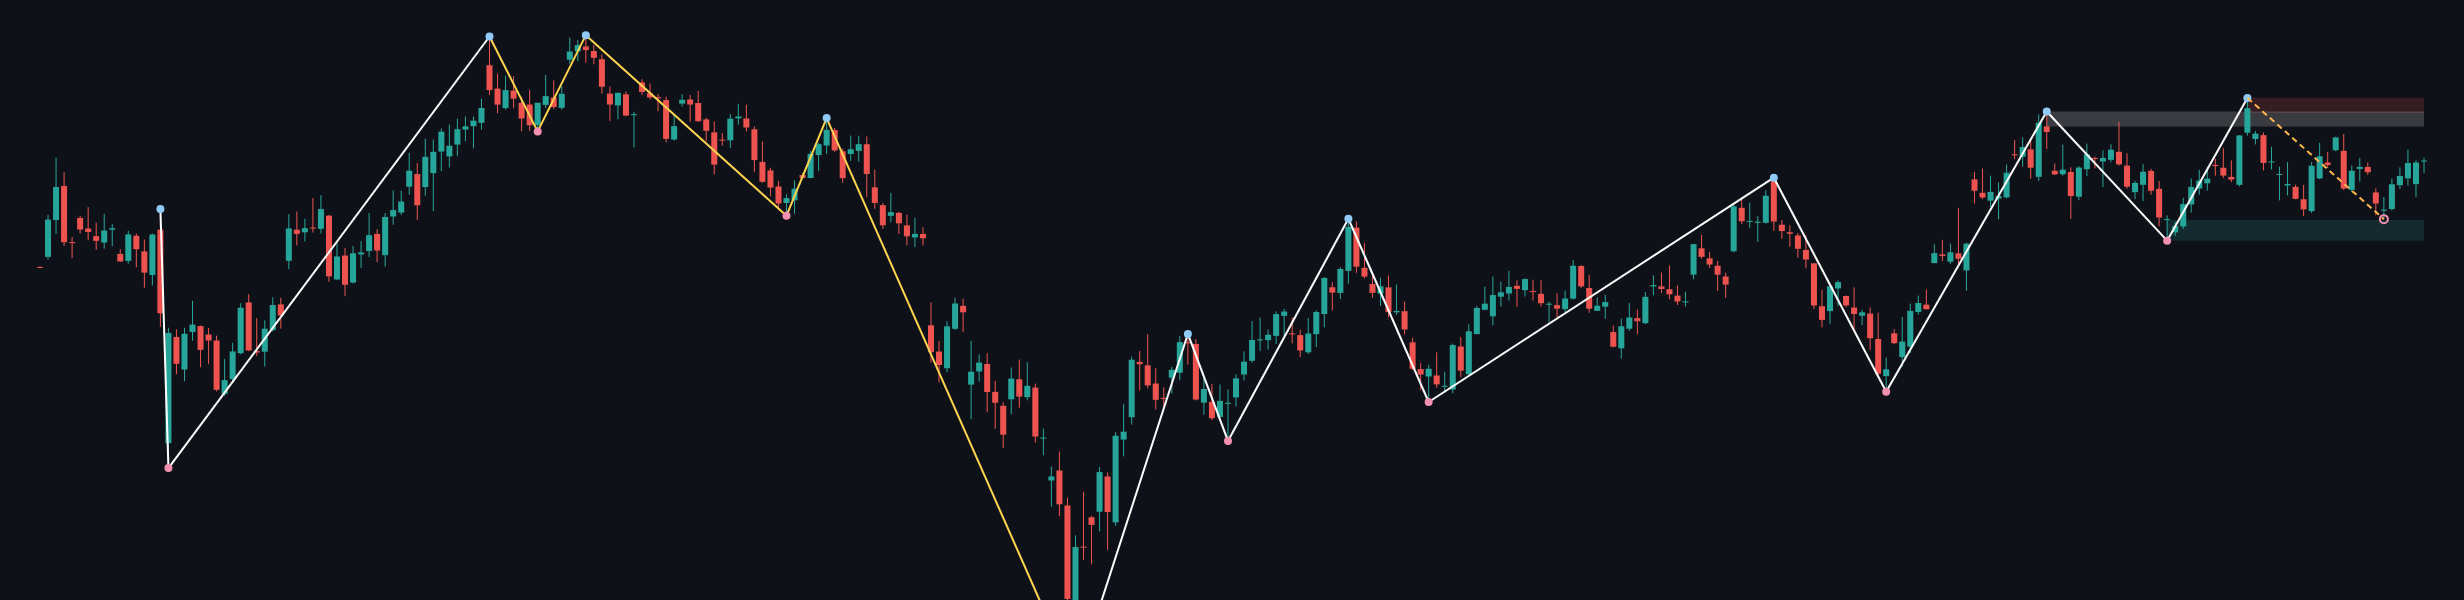
The weekly structure remains firmly upward, while its sub-trend is down. No weekly structure event is reported, so the broader bullish structure has not been formally invalidated. The most recent confirmed weekly swing is a high at 1.38704, with weekly resistance extending from 1.37798 to 1.38704.
Below the current market, the weekly support zone is 1.30097–1.31346. A separate broken-retest support zone is marked at 1.36978–1.37884. Because the latest weekly close at 1.34927 is below that broken-retest area, it currently acts as an overhead reference rather than nearby support. Weekly ATR is 0.01813, indicating that the broader frame allows materially wider movement than the daily structure currently shows.
Weekly moving-average values and their exact relationship to price are not provided in the deterministic report, so no precise moving-average conclusion is made. The higher-timeframe reading permits further upside if price can reclaim and hold the broken-retest area, but it also permits a deeper correction toward 1.30097–1.31346 if daily support fails.
Main-frame structure
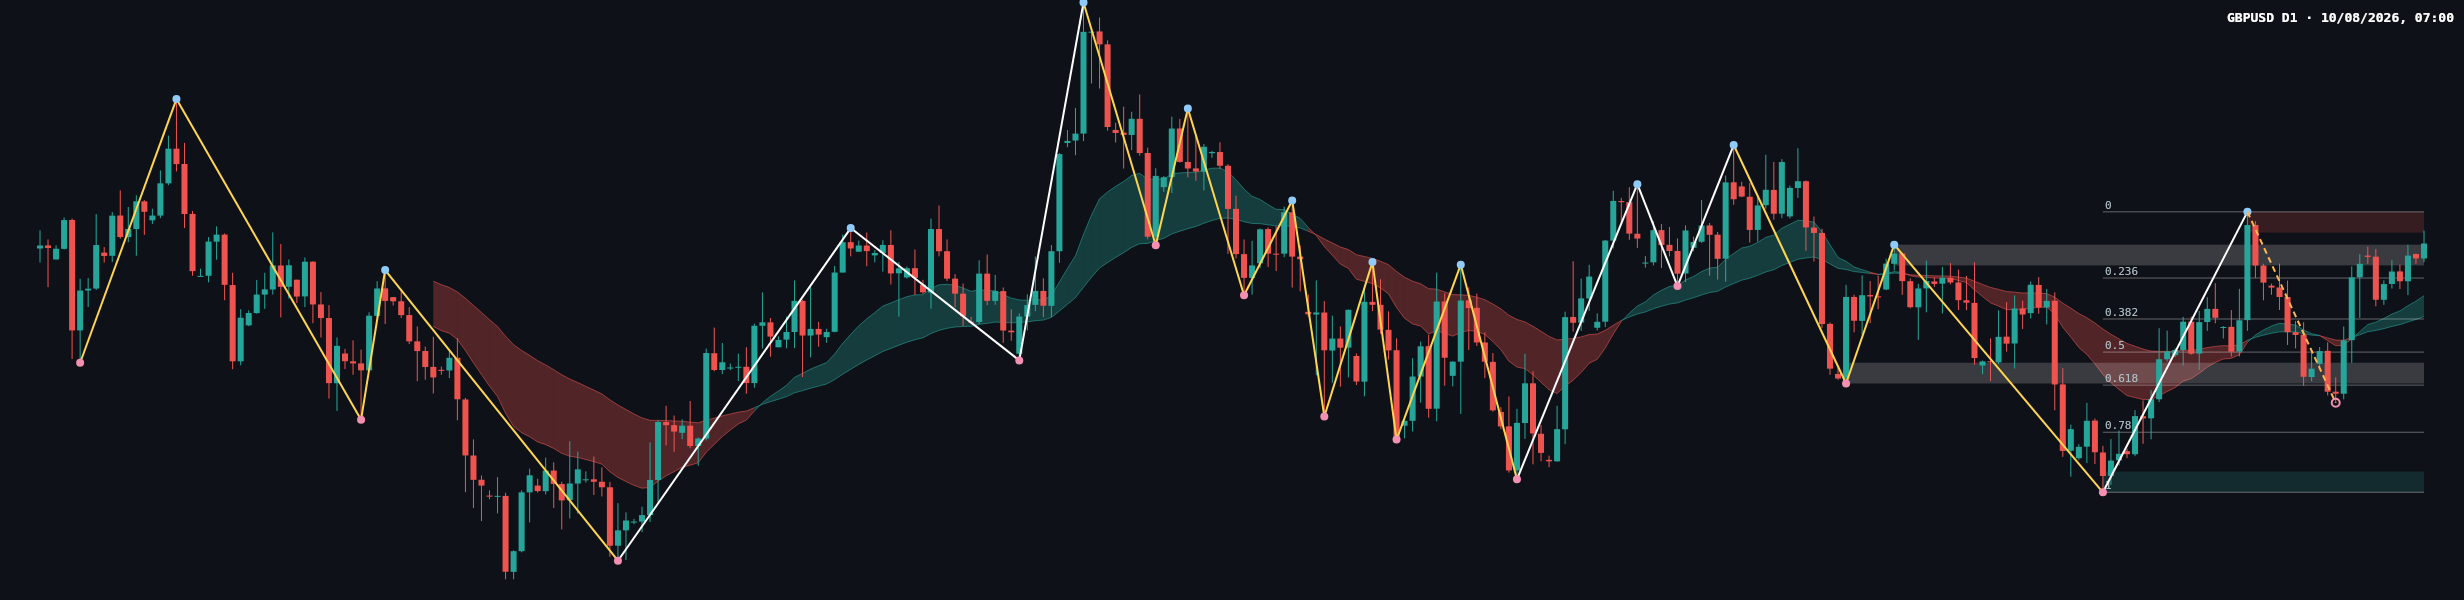
The daily trend is sideways and firm, with a downward sub-trend. It does not fully align with the weekly upward trend. This mismatch is consistent with a corrective phase inside the broader weekly advance, although a sustained break beneath daily support would make the bearish interpretation more significant.
The daily resistance zone is 1.35271–1.35580, and the most recent confirmed daily swing high is 1.35580. The daily support zone is 1.31395–1.31704, while the broken-retest support zone is 1.34781–1.35090. The last closed price at 1.35107 is above the latter zone but remains close enough for a rejection or retest to remain relevant.
The latest completed daily Dow leg has Fibonacci levels at 0: 1.35580, 0.236: 1.34592, 0.382: 1.33981, 0.5: 1.33487, 0.618: 1.32994, 0.786: 1.32291, and 1: 1.31395. The current retracement ratio is 0.113, placing the market close to the upper part of this completed leg rather than near its deeper retracement references.
Daily ATR is 0.00618. Exact EMA values, slopes, spacing and crossover status are not provided, so the moving-average bands visible on the chart are treated only as background confirmation rather than as precise levels.
Key levels and recent price behaviour
The most recent candles show an attempted recovery from the area around 1.34781–1.35090, followed by hesitation beneath 1.35271–1.35580. The visible swing sequence is therefore mixed: buyers have defended the nearby support area, but sellers have retained influence beneath the latest confirmed high at 1.35580.
The latest closing candle should be read in relation to the close at 1.35107. Its exact candle classification, wick proportions and position within the full candle range are not determinable from the deterministic report. What is clear is that the close is above 1.34781–1.35090 and below 1.35271–1.35580, which describes a market still trapped between nearby support and resistance rather than one that has confirmed a directional break.
- 1.35271–1.35580: daily resistance and the area required for a clearer bullish continuation signal.
- 1.34781–1.35090: daily broken-retest support and the immediate downside test.
- 1.34592: Fibonacci 0.236 reference below the immediate support area.
- 1.33981: Fibonacci 0.382 reference.
- 1.33487: Fibonacci 0.5 reference and near the broken-retest resistance zone at 1.33019–1.33328.
- 1.32994: Fibonacci 0.618 reference.
- 1.31395–1.31704: deeper daily support.
Conditional scenarios
Bullish scenario
If price closes above 1.35271–1.35580 and subsequently holds that area as support, the daily range would resolve upward. The first structural reference would be the weekly broken-retest zone at 1.36978–1.37884, followed by weekly resistance at 1.37798–1.38704. This scenario is invalidated if price returns below 1.34781–1.35090 after the attempted breakout.
Bearish scenario
If price closes below 1.34781–1.35090, sellers would gain evidence that the broken-retest support has failed. The next Fibonacci references are 1.34592, 1.33981, 1.33487 and 1.32994, with the broken-retest resistance zone at 1.33019–1.33328 also becoming relevant. This scenario is invalidated by a sustained recovery above 1.35271–1.35580.
Range and failed-break scenario
If price remains between 1.34781–1.35090 and 1.35271–1.35580, the sideways daily structure remains intact. A brief move beyond either zone that closes back inside the range would indicate rejection rather than confirmation. The range interpretation is invalidated by sustained acceptance above 1.35580 or below 1.34781.
No numeric scenario probabilities are assigned because the deterministic report does not provide probability estimates. The directional bias is marginally constructive while price remains above 1.34781–1.35090, but the broader daily range is not resolved until either boundary is convincingly broken.
Key considerations
- Monitor 1.35271–1.35580 for acceptance or rejection.
- Monitor 1.34781–1.35090 for support retention or failure.
- If selling persists, observe 1.34592, 1.33981, 1.33487 and 1.32994.
- For broader context, observe 1.36978–1.37884, 1.37798–1.38704 and 1.30097–1.31346.
- False breaks and liquidity sweeps around the daily zones remain possible, so confirmation should come from a closing-price response rather than an isolated intraday move.
- No specific news or economic-calendar schedule was supplied with the report. Traders should independently check relevant economic releases and headline risk before interpreting a break.
Summary
- The weekly trend is up and firm, but the weekly sub-trend is down.
- The daily structure is sideways, with the latest close at 1.35107.
- Daily support is 1.34781–1.35090; daily resistance is 1.35271–1.35580.
- A break below support would expose Fibonacci references from 1.34592 toward 1.31395.
- A break above resistance would refocus attention on 1.36978–1.37884 and 1.37798–1.38704.
The single most important thing is whether GBPUSD can establish acceptance above 1.35271–1.35580 or instead lose 1.34781–1.35090.
#GBPUSD #Forex #PriceAction #DowTheory #TechnicalAnalysis
Meta description: GBPUSD daily analysis: price holds above support while resistance caps the recovery, with bullish and bearish scenarios around key zones.
This article is technical analysis and reference information only, not investment advice. Markets carry risk, and readers are responsible for their own decisions.