
GBPUSD remains in a firm sideways structure on the Daily timeframe, with the sub-trend pointing down. The latest Daily close is 1.34502, below the nearby 1.34739–1.35090 broken-retest zone and beneath the main resistance area at 1.35229–1.35580. The key question is whether price can reclaim the broken-retest area or continue toward lower Fibonacci support.
| Metric | Reading |
|---|---|
| Daily last closed price | 1.34502 |
| Weekly last closed price | 1.34804 |
| Weekly trend | Down, with an up sub-trend |
| Daily trend | Sideways, with a down sub-trend |
| Nearest resistance | 1.35229–1.35580 |
| Nearest support area | 1.34739–1.35090 broken-retest zone |
| Lower Daily support | 1.31395–1.31746 |
| Current retracement ratio | 0.258 |
Higher-timeframe context: Weekly
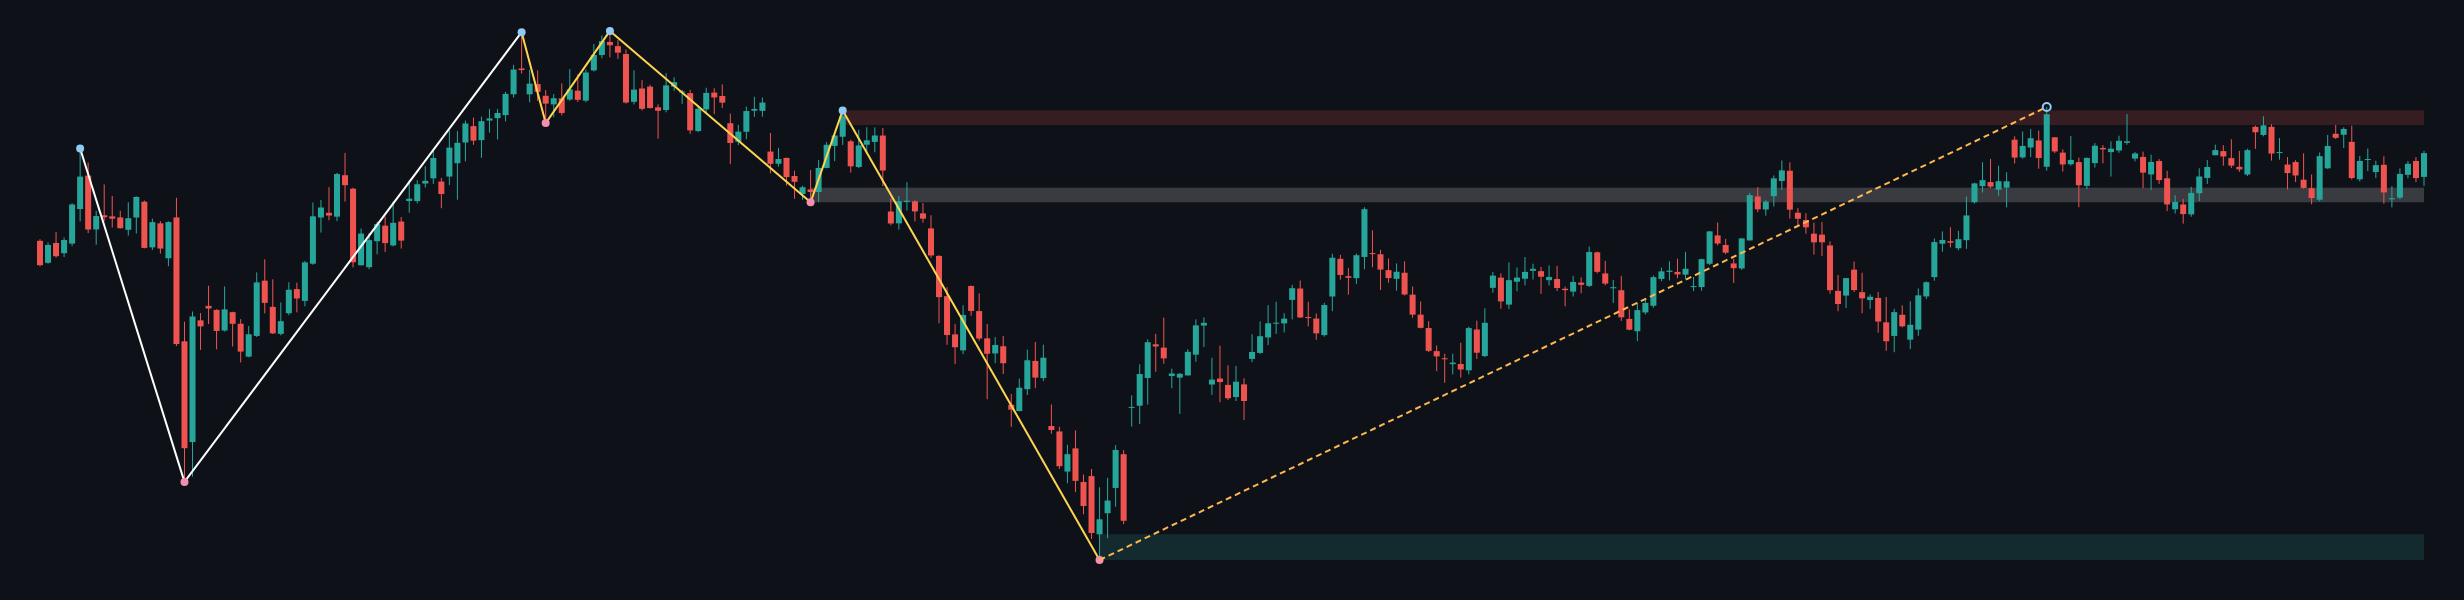
The Weekly framework remains firmly down, although its sub-trend is up. There is no confirmed structure event in the report, so the broader bearish structure has not been replaced by a confirmed bullish break. The most recent confirmed Weekly swing is a low at 1.09232.
GBPUSD is trading below the Weekly resistance zone at 1.36573–1.37487. A further Weekly resistance area is located at 1.31717–1.32631, identified as a broken-retest zone. The Weekly support zone is much lower, at 1.09232–1.10850. The Weekly ATR is 0.01829, indicating a broader volatility scale than the Daily ATR of 0.00702.
The Weekly chart does not provide a reported Fibonacci level for the current price interaction. The higher-timeframe conclusion is therefore conditional: the up sub-trend can continue while price holds above important lower-timeframe supports, but the firm Weekly downtrend keeps overhead resistance relevant.
Main-frame structure: Daily
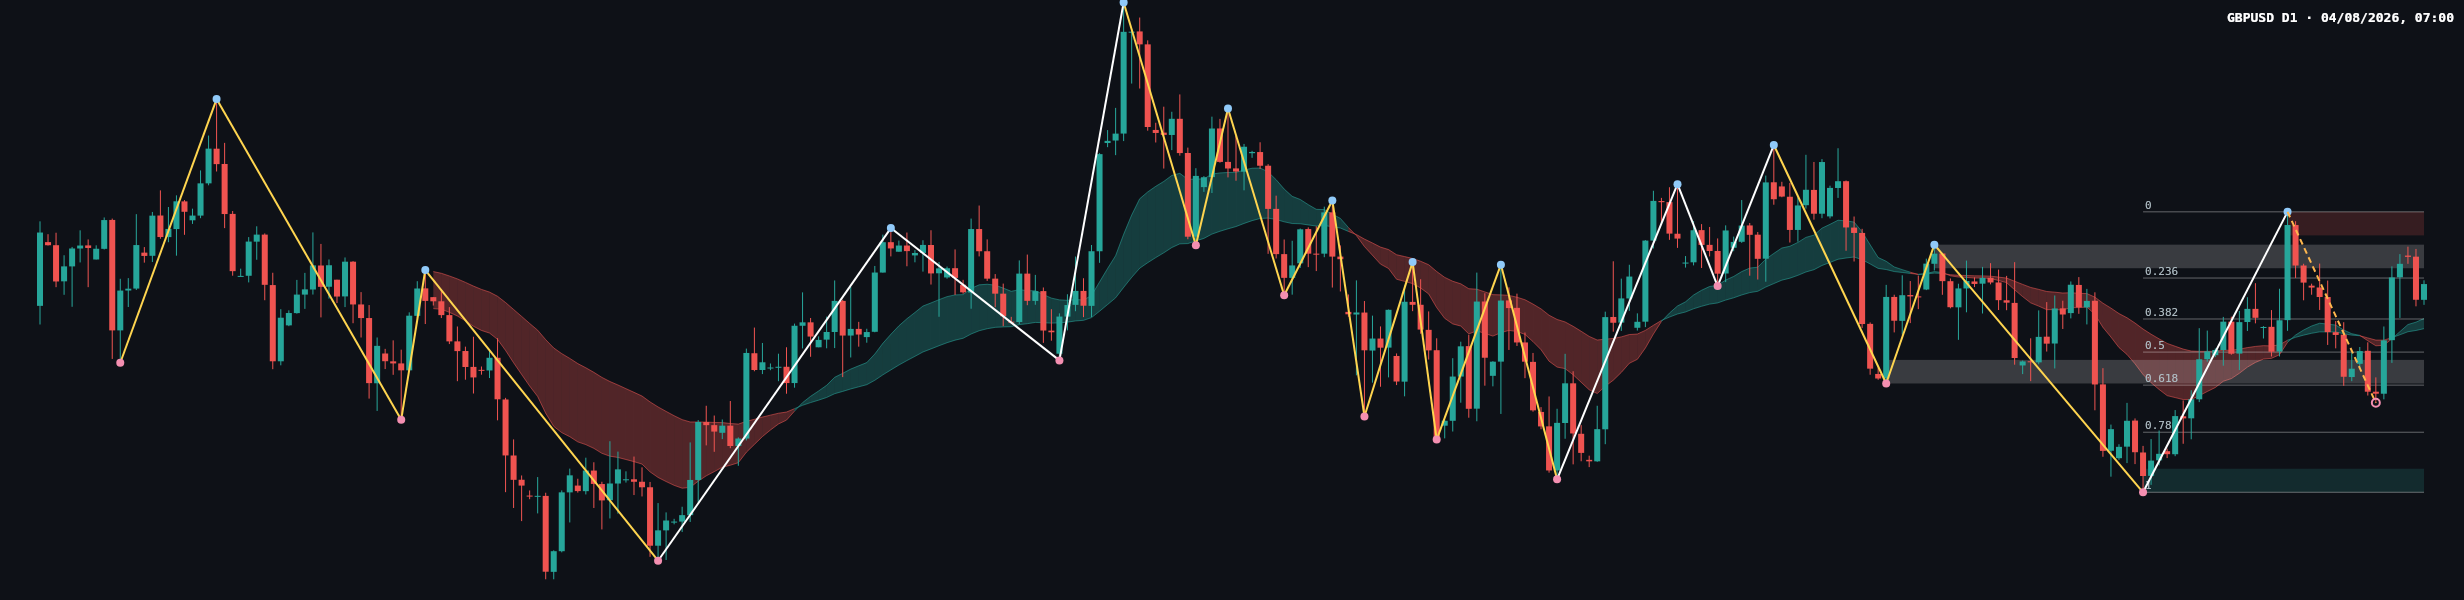
The Daily trend is sideways and firm, while the sub-trend is down. This does not yet amount to a confirmed reversal because the report identifies no structure event. The most recent confirmed Daily swing is a high at 1.35580, which also forms the upper boundary of the principal resistance zone at 1.35229–1.35580.
The latest completed Dow leg runs from 1.35580 to 1.31395. Its reported Fibonacci levels are 0: 1.35580, 0.236: 1.34592, 0.382: 1.33981, 0.5: 1.33487, 0.618: 1.32994, 0.786: 1.32291, and 1: 1.31395. The current retracement ratio is 0.258, placing the latest close near the 0.236 reference at 1.34592.
Price is also below the Daily broken-retest resistance zone at 1.34739–1.35090. That area is important because a recovery into it could test whether former support has become resistance. Conversely, sustained acceptance below it would keep the lower Fibonacci references at 1.33981, 1.33487, and 1.32994 in view.
The chart shows price interacting with coloured moving-average bands, but the deterministic report does not provide their numerical values or a confirmed crossover. Their exact distances and slopes are therefore not determinable from the permitted data. Volume and a separate momentum reading are also not included in the report.
Key levels and recent price behaviour
- 1.35229–1.35580: principal Daily resistance and the area containing the most recent confirmed swing high.
- 1.34739–1.35090: broken-retest resistance that price is currently below.
- 1.34592: the reported 0.236 Fibonacci level, close to the latest Daily close.
- 1.33981: the reported 0.382 Fibonacci level.
- 1.33487: the reported 0.5 Fibonacci level.
- 1.32994: the reported 0.618 Fibonacci level.
- 1.31395–1.31746: Daily support zone and the lower endpoint of the latest completed Dow leg.
- 1.36573–1.37487: higher-timeframe resistance above the Daily range.
The latest candle should be read in relation to these zones rather than in isolation. The close at 1.34502 is below 1.34592 and below the 1.34739–1.35090 broken-retest area. The exact candle classification, body-to-wick proportions, and close position within the candle range are not determinable from the deterministic report.
Conditional scenarios
Primary scenario: continued range pressure
If price remains below 1.34739–1.35090 and sellers retain control of the Daily sub-trend, the market may continue to probe the Fibonacci references at 1.33981, 1.33487, and potentially 1.32994. This is the higher-likelihood interpretation while the Daily structure remains sideways with a down sub-trend. The scenario is weakened if price reclaims and holds above 1.35090.
Secondary scenario: recovery into resistance
If GBPUSD recovers above 1.34739–1.35090, the next area to observe is 1.35229–1.35580. A move into that zone would represent a test of Daily resistance rather than a confirmed bullish reversal. Failure to clear 1.35580 would preserve the sideways structure. The recovery scenario is invalidated by renewed acceptance below 1.34592.
Risk scenario: broader bullish extension
If price breaks and holds above 1.35580, the Daily bearish sub-trend would be challenged. The next higher-timeframe area to monitor would be 1.36573–1.37487. This scenario would lose credibility if price falls back below 1.35229 after the attempted break.
Overall, the bias leans cautiously bearish within a broader Daily range, with the market’s near-term behaviour likely defined by the relationship between 1.34592, 1.34739–1.35090, and 1.35229–1.35580.
What to monitor
- Whether price can reclaim 1.34739–1.35090 and hold above it on a Daily closing basis.
- Whether 1.34592 continues to act as a nearby reference or gives way toward 1.33981.
- Whether a test of 1.35229–1.35580 produces acceptance above resistance or another rejection.
- Whether the Daily structure records a confirmed break; the current report identifies no structure event.
- Whether volatility expands beyond the Daily ATR of 0.00702 or remains contained within the range.
No news or economic-calendar context was supplied with the market data. Traders following the pair should independently monitor scheduled releases, central-bank communication, the US dollar, gilt and Treasury yields, and geopolitical headlines; the report does not provide an exact event time window.
General risk principles remain relevant in either direction: avoid treating a zone as a guaranteed turning point, account for volatility around major news, and define risk before acting. The scenarios above describe market conditions, not trade instructions.
Summary
- The Weekly trend is firmly down, despite an up sub-trend.
- The Daily market is sideways, with a down sub-trend and no confirmed structure event.
- The latest close at 1.34502 is below the 0.236 Fibonacci reference at 1.34592.
- The broken-retest area at 1.34739–1.35090 is the immediate reclaim zone.
- Resistance at 1.35229–1.35580 separates a range recovery from a more meaningful bullish challenge.
The single most important thing to watch is whether price remains below or reclaims the 1.34739–1.35090 broken-retest zone.
SEO description: GBPUSD remains range-bound on the Daily chart, with bearish pressure below 1.34739–1.35090 and resistance at 1.35229–1.35580.
Technical analysis is provided for reference only and is not investment advice. Markets carry risk, and readers are responsible for their own decisions.