
BTCUSD’s daily structure remains upward overall, but the current sub-trend is downward and price is consolidating near a significant resistance zone. The daily close is 84843.43, close to the 0.236 Fibonacci level at 84449.64; meanwhile, the weekly context shows a firm downtrend with an upward sub-trend. That mixed picture makes the response at nearby support and resistance important.
| Metric | Reading |
|---|---|
| Daily last closed price | 84843.43 |
| Weekly context close | 84422.39 |
| Weekly / daily trend | Down (firm), sub-trend up / up (firm), sub-trend down |
| Daily EMA20 and EMA50 | Not provided in the deterministic report |
| Nearest daily resistance | 86261.66–87401.93 |
| Nearby Fibonacci level | 0.236: 84449.64 |
| Daily ATR | 2280.53 |
Higher-timeframe context
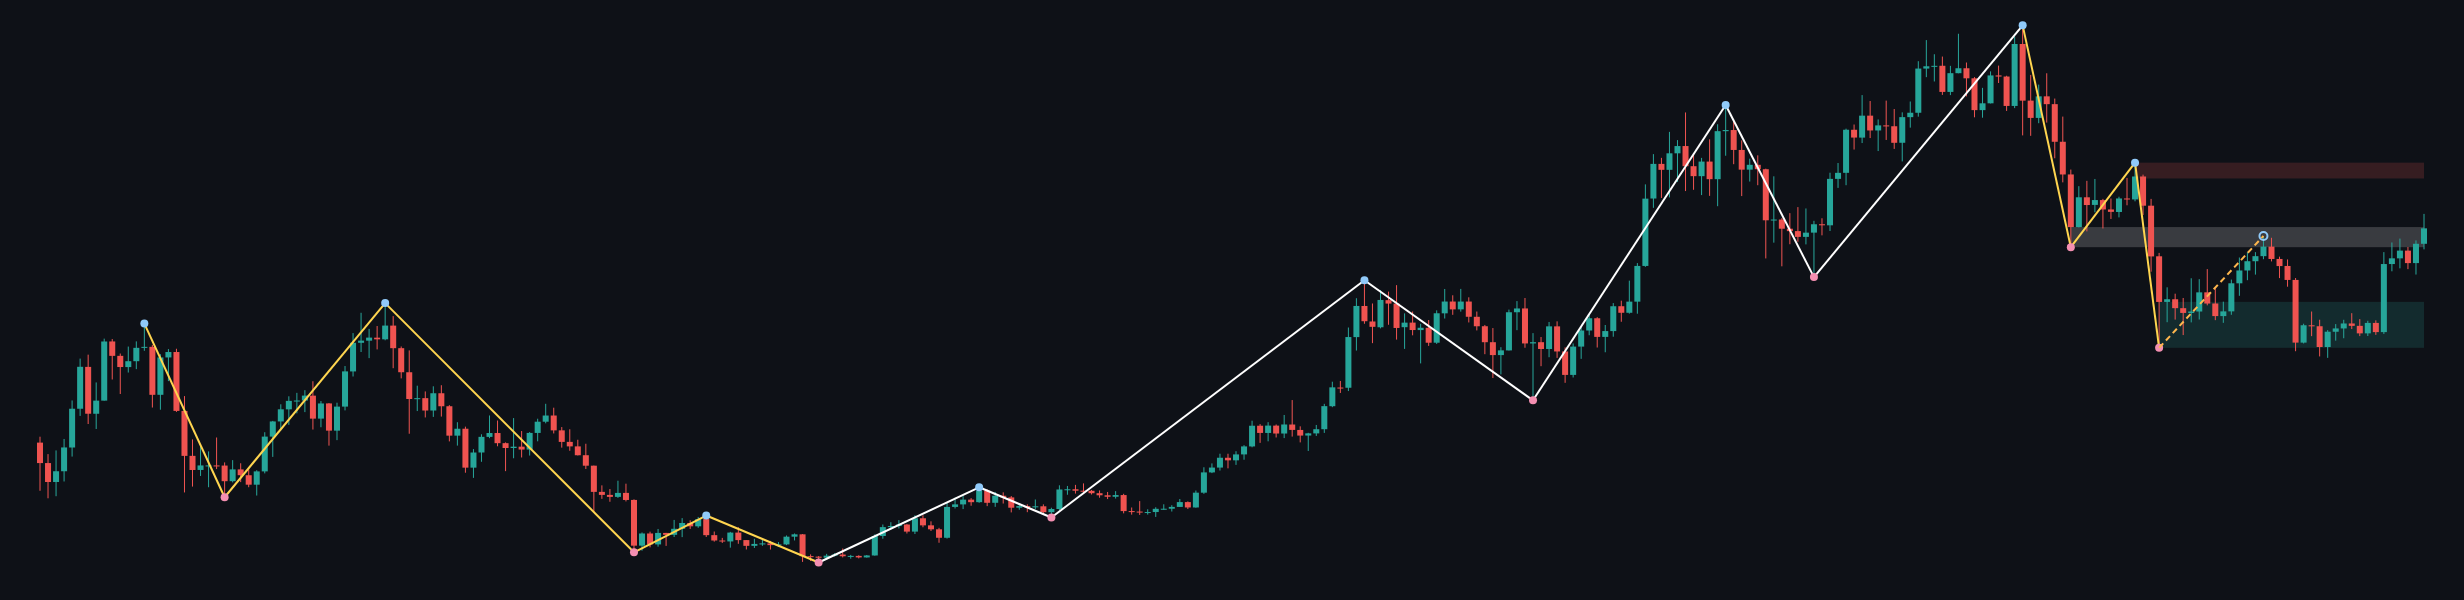
The weekly frame is classified as a firm downtrend, with an upward sub-trend. Its most recent confirmed swing is the low at 59783.75, and the report records no new structure event. The weekly context close of 84422.39 is within the broken-retest resistance zone at 80538.63–84683.30, so that area is a key test: sustained acceptance above it would improve the broader picture, while renewed rejection would leave the weekly downtrend in control.
Further weekly resistance is marked at 94721.06–97971.19. The listed weekly support zone is 59783.75–69241.82. Weekly ATR is 6500.26, indicating a wider historical range than the daily ATR; it does not determine the next move.
Main-frame structure
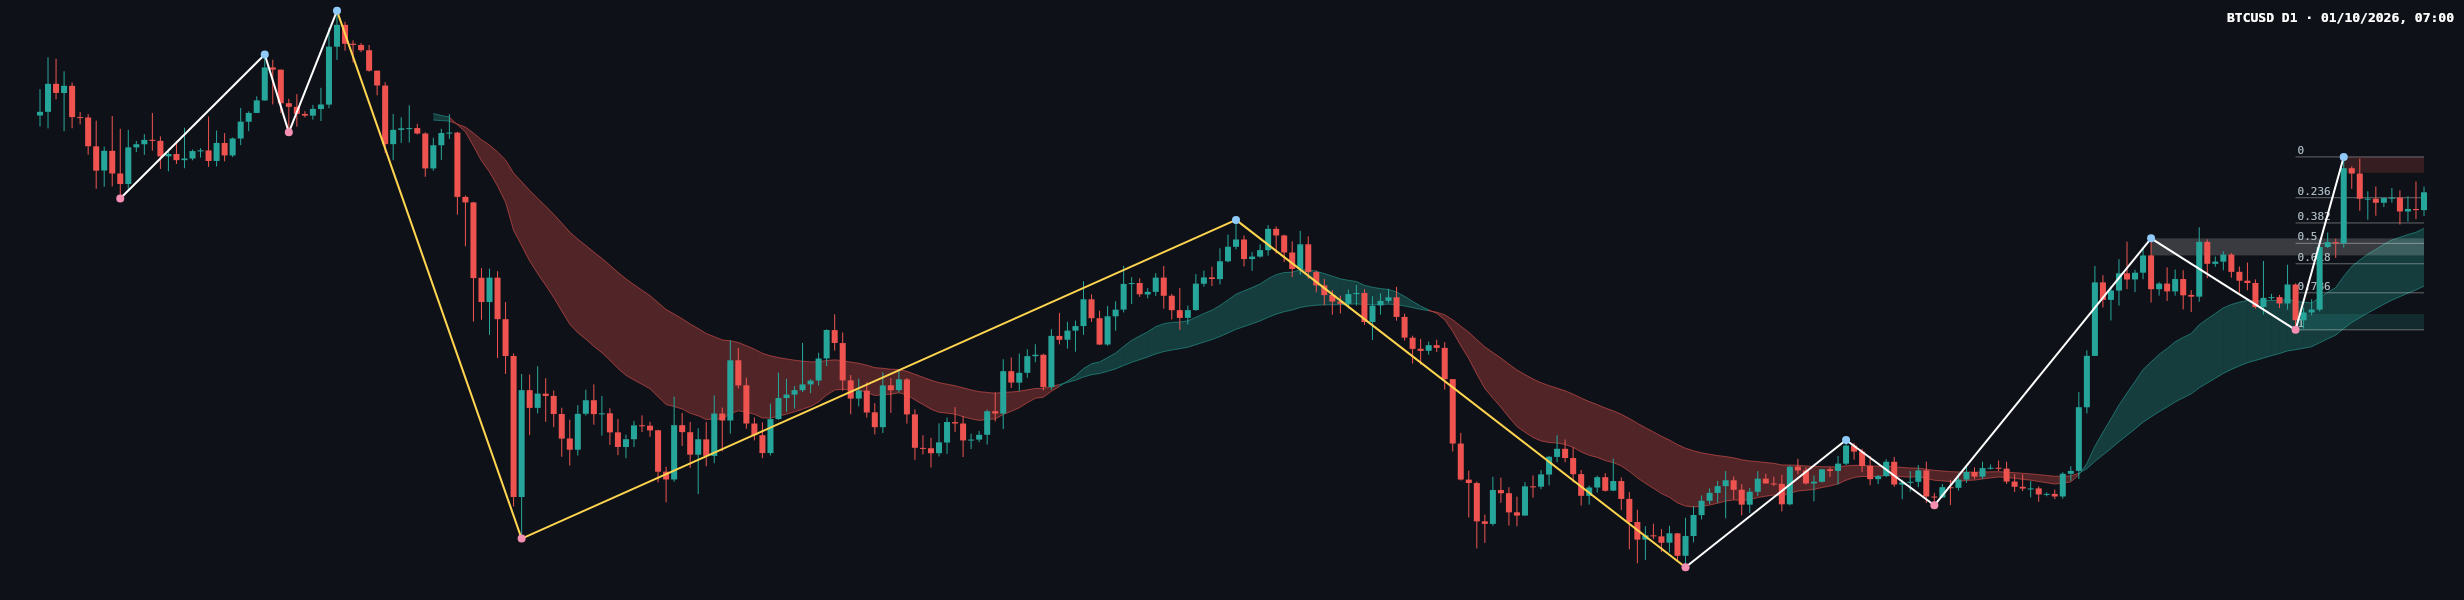
On the daily frame, the main trend is up (firm), while the sub-trend is down. The chart shows a strong advance from a lower base followed by a pullback and rebound into consolidation. The deterministic report records no structure event, so there is no confirmed break of structure to use as evidence of a new directional change. The most recent confirmed swing high is 87401.93.
The latest completed Dow leg spans 74892.24 to 87401.93. Its listed Fibonacci levels are 0.236 at 84449.64, 0.382 at 82623.23, 0.5 at 81147.08, 0.618 at 79670.94, and 0.786 at 77569.31. The current retracement ratio is 0.205. Price is near the 0.236 level, but the report does not establish that this level has held as support. EMA values, candle-by-candle OHLC data, and volume are not supplied in the deterministic report, so they cannot be assessed precisely here.
Key levels
- Daily resistance: 86261.66–87401.93. A sustained move above the zone would be a constructive daily development; rejection would keep the immediate ceiling in place.
- Nearby Fibonacci reference: 84449.64. The daily close of 84843.43 is near this level, making it a useful reference for whether the pullback is stabilizing.
- Broken-retest support: 80277.00–81509.20. A move into this zone would put the prior broken-retest area under examination.
- Lower daily support: 74892.24–76032.51, which includes the low of the latest completed Dow leg.
- Weekly context zone: 80538.63–84683.30, identified as broken-retest resistance; the weekly frame’s higher resistance is 94721.06–97971.19.
Scenarios
Bullish continuation
If BTCUSD clears and holds above daily resistance at 86261.66–87401.93, the daily uptrend would have stronger confirmation. The next broader reference is weekly resistance at 94721.06–97971.19. A return below 84449.64 would weaken this scenario; this is a structural reference, not an order level.
Bearish pullback
If price is rejected from 86261.66–87401.93 and then falls below 84449.64, attention would shift to the broken-retest support zone at 80277.00–81509.20. A deeper pullback could bring the daily support zone at 74892.24–76032.51 into view. A sustained move above 87401.93 would invalidate this bearish reading of the immediate structure.
Consolidation
If price remains between 84449.64 and 86261.66 without a confirmed move through either boundary, the market may continue to consolidate around the nearby Fibonacci reference and resistance. A sustained move above 87401.93 or below 82623.23 would make this range interpretation less persuasive.
The daily trend gives buyers a broader structural advantage, but the weekly downtrend and nearby resistance argue for waiting on confirmation rather than assuming continuation. The key near-term test is the reaction around 84449.64 and 86261.66–87401.93.
#BTCUSD #Bitcoin #TechnicalAnalysis #DailyOutlook #PriceAction
Meta description: BTCUSD daily analysis of the 84449.64 Fibonacci reference, nearby resistance, weekly context, and conditional bullish and bearish scenarios.
This article is technical analysis for reference only, not investment advice. Markets carry risk, and readers are responsible for their own decisions.