
BTCUSD is attempting to recover within a broader bearish structure. The weekly and daily main trends are both down and firm, while their sub-trends are up. On the daily frame, the latest closed price is 77388.10, close to the 0.786 Fibonacci level at 77464.66; the immediate question is whether price can progress through the daily resistance zone at 81426.29–82844.58 or instead lose the nearby retracement structure.
Higher-timeframe context: Weekly
The weekly framework remains bearish according to the supplied structure reading: the main trend is down and firm, the sub-trend is up, and no structure event has been recorded. The most recent confirmed weekly swing is the low at 59783.75. This combination describes a recovery inside a larger decline rather than a confirmed change in direction.
The weekly chart shows overhead resistance at 80538.63–84683.30, identified as a broken-retest zone. A sustained move through that area would improve the higher-timeframe recovery case, while failure there would preserve the bearish context. Further overhead, the major weekly resistance zone is 94689.81–97971.19. Below the market, weekly support is marked at 59783.75–69241.82.
The weekly ATR is 6562.77, indicating that the broader frame allows for substantial movement around these zones. The report does not provide numerical weekly moving-average values, so their exact position, spacing, or crossover status is not determinable from the report.
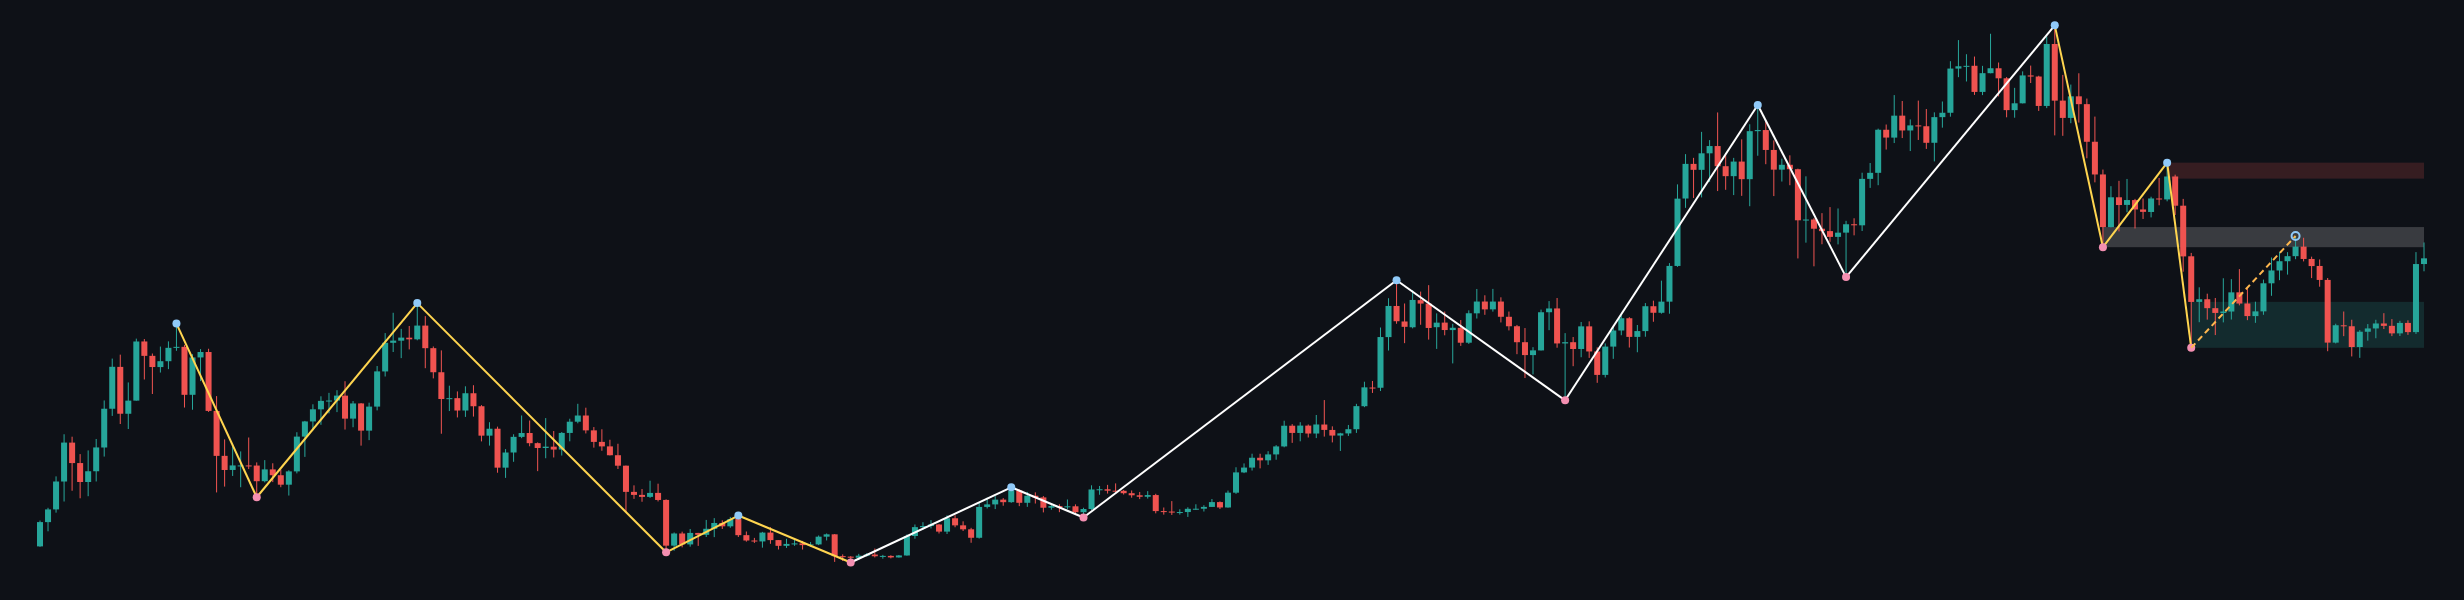
Weekly conclusion: The higher timeframe permits further recovery while the sub-trend remains up, but it still favors caution because the firm main trend is down and price is approaching the broken-retest resistance at 80538.63–84683.30.
Main-frame structure: Daily
The daily frame aligns with the weekly direction: the main trend is down and firm, while the sub-trend is up. No daily structure event has been recorded. The latest confirmed daily swing low is 57704.79, with the daily support zone at 57704.79–58893.97. The recovery from that area has moved price back toward the upper portion of the latest completed Dow leg.
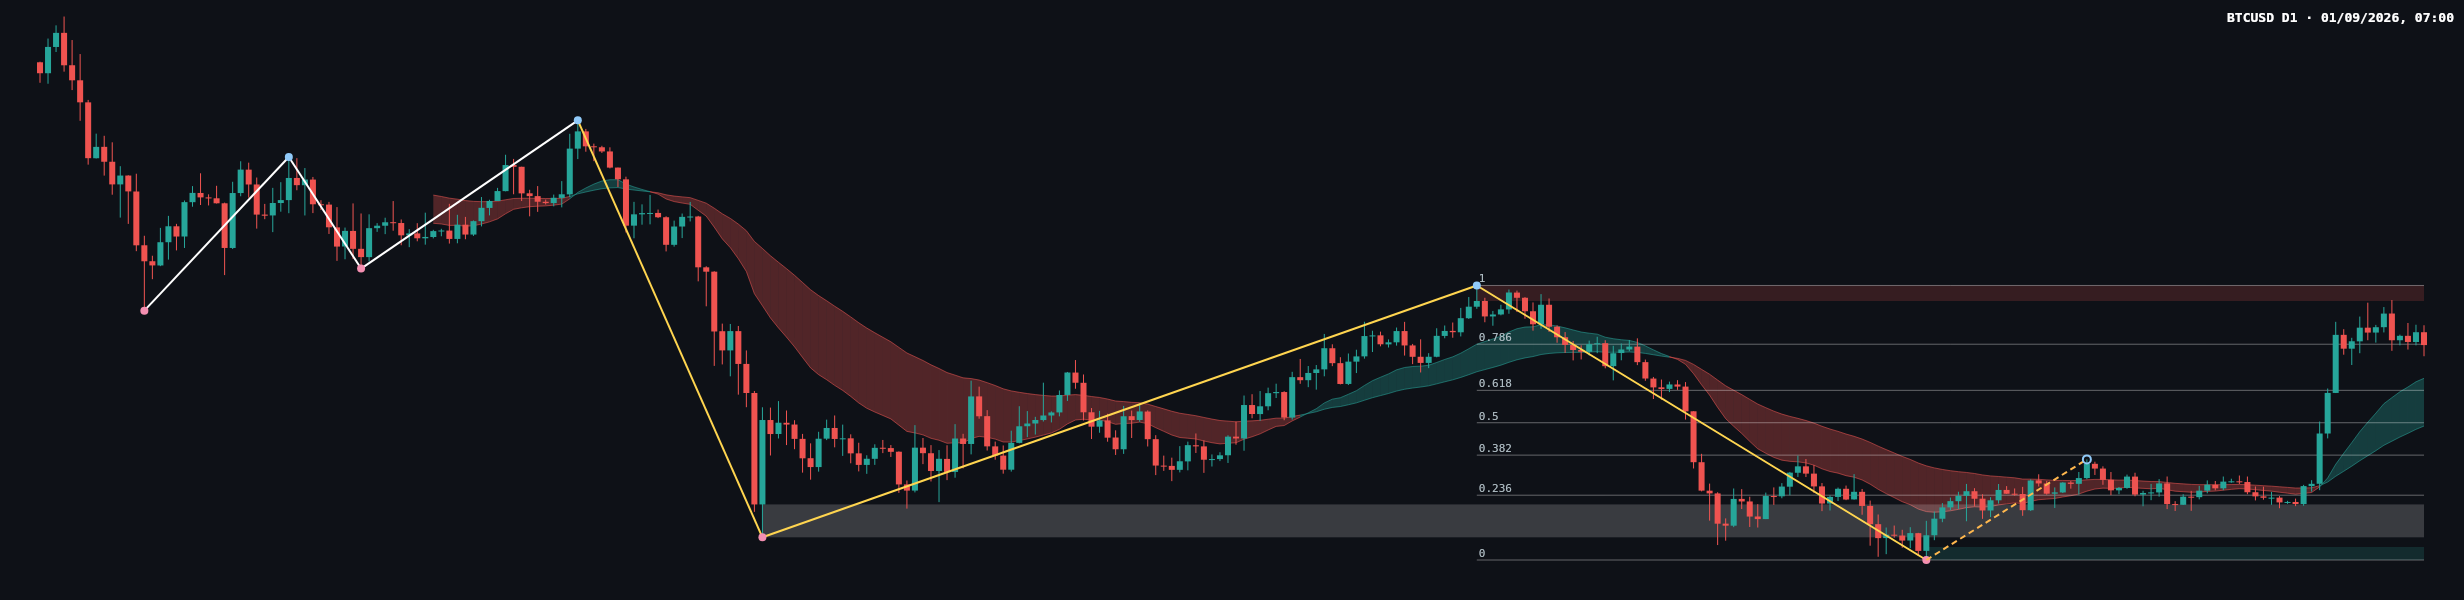
The daily resistance zone at 81426.29–82844.58 is the main decision area. It also corresponds to the upper endpoint of the listed Fibonacci leg, with 1 at 82844.58. A failure beneath this area would leave the advance vulnerable to a return toward the intermediate Fibonacci levels at 77464.66, 73241.18, and 70274.69.
The daily ATR is 2378.35. This supports a volatile but still technically bounded interpretation while price remains between the retracement reference points and the resistance zone. The report does not provide numerical daily moving-average values, so the exact EMA position, slope, spacing, and crossover status are not determinable from the report.
Daily Fibonacci and recent price action
The latest completed Dow leg runs from 57704.79 at the lower endpoint to 82844.58 at the upper endpoint. Its listed levels are 63637.78 at 0.236, 67308.19 at 0.382, 70274.69 at 0.5, 73241.18 at 0.618, and 77464.66 at 0.786. The current retracement ratio is 0.783, placing the latest daily close very near the 0.786 reference.
The chart shows a prolonged decline from the upper part of the leg, followed by basing near the lower support area and a sharp recovery. The most recent candles are clustered beneath the daily resistance zone rather than displaying a confirmed breakout. Their consolidation suggests that buyers have regained short-term control, but sellers remain active near the upper boundary. Candle-by-candle body and wick classifications, as well as volume or momentum confirmation, are not specified in the deterministic report and should therefore be treated as not determinable from the report.
Daily conclusion: The upward sub-trend is constructive, but the broader daily trend remains bearish until price establishes acceptance above 81426.29–82844.58. The 0.786 level at 77464.66 is the immediate reference for whether the recovery remains supported.
Key levels
- Daily resistance: 81426.29–82844.58.
- Weekly broken-retest resistance: 80538.63–84683.30.
- Major weekly resistance: 94689.81–97971.19.
- Fibonacci references: 77464.66 at 0.786, 73241.18 at 0.618, and 70274.69 at 0.5.
- Daily broken-retest resistance: 59783.75–62793.85.
- Weekly support: 59783.75–69241.82.
- Daily support: 57704.79–58893.97.
Scenarios
Primary scenario: rejection or consolidation beneath resistance
If price remains below 81426.29–82844.58 and loses the nearby 0.786 reference at 77464.66, the recovery would remain a counter-trend advance within the firm bearish structure. The next downside references would be 73241.18 and 70274.69, with the broader support areas at 59783.75–69241.82 and 57704.79–58893.97. This scenario is invalidated by sustained acceptance above 82844.58. Qualitatively, this is the higher-probability scenario while no structure event has been recorded.
Secondary scenario: confirmed bullish continuation
If price closes above 81426.29–82844.58 and holds that area on a retest, the daily sub-trend would have stronger evidence of continuation. The weekly broken-retest zone at 80538.63–84683.30 would then be treated as reclaimed, opening a path toward the major weekly resistance at 94689.81–97971.19. This scenario is invalidated by a return below 77464.66 after the breakout attempt. Its likelihood improves only after a confirmed close and successful retest.
Risk scenario: deeper bearish continuation
If selling pressure takes price below 70274.69 and then through 67308.19, the recovery structure would be materially weakened. A move toward 59783.75–62793.85 and the lower support areas at 57704.79–58893.97 would become the relevant bearish pathway. This scenario is invalidated by a sustained recovery above 77464.66. It would represent a stronger continuation of the existing main trend rather than a short-term rejection alone.
Closing view
BTCUSD is at a technically important crossroads: the daily close of 77388.10 is near 77464.66, while the next major test is the resistance band at 81426.29–82844.58. The upward sub-trends keep the recovery case active, but the firm bearish main trends and absence of a recorded structure event mean that confirmation is still required. The cleanest interpretation is to monitor acceptance or rejection around the resistance zone and the behavior of price around 77464.66, 73241.18, and 70274.69.
#BTCUSD #Bitcoin #TechnicalAnalysis #PriceAction #DowTheory
Meta description: BTCUSD daily analysis: recovery approaches 81426.29–82844.58 resistance while the broader weekly and daily trends remain bearish.
This article is technical analysis and reference information only, not investment advice. Markets carry risk, and readers are responsible for their own decisions.