
BTCUSD is presenting a mixed multi-timeframe picture. The Weekly frame remains firmly sideways, with the latest closed price at 63020.22 near the 62409.68–67488.06 support zone. On the Daily frame, the latest close is 64680.37: the main trend remains down, although the sub-trend is up and price is holding above the former Daily resistance zone at 59783.75–62793.85.
Higher-timeframe context — Weekly
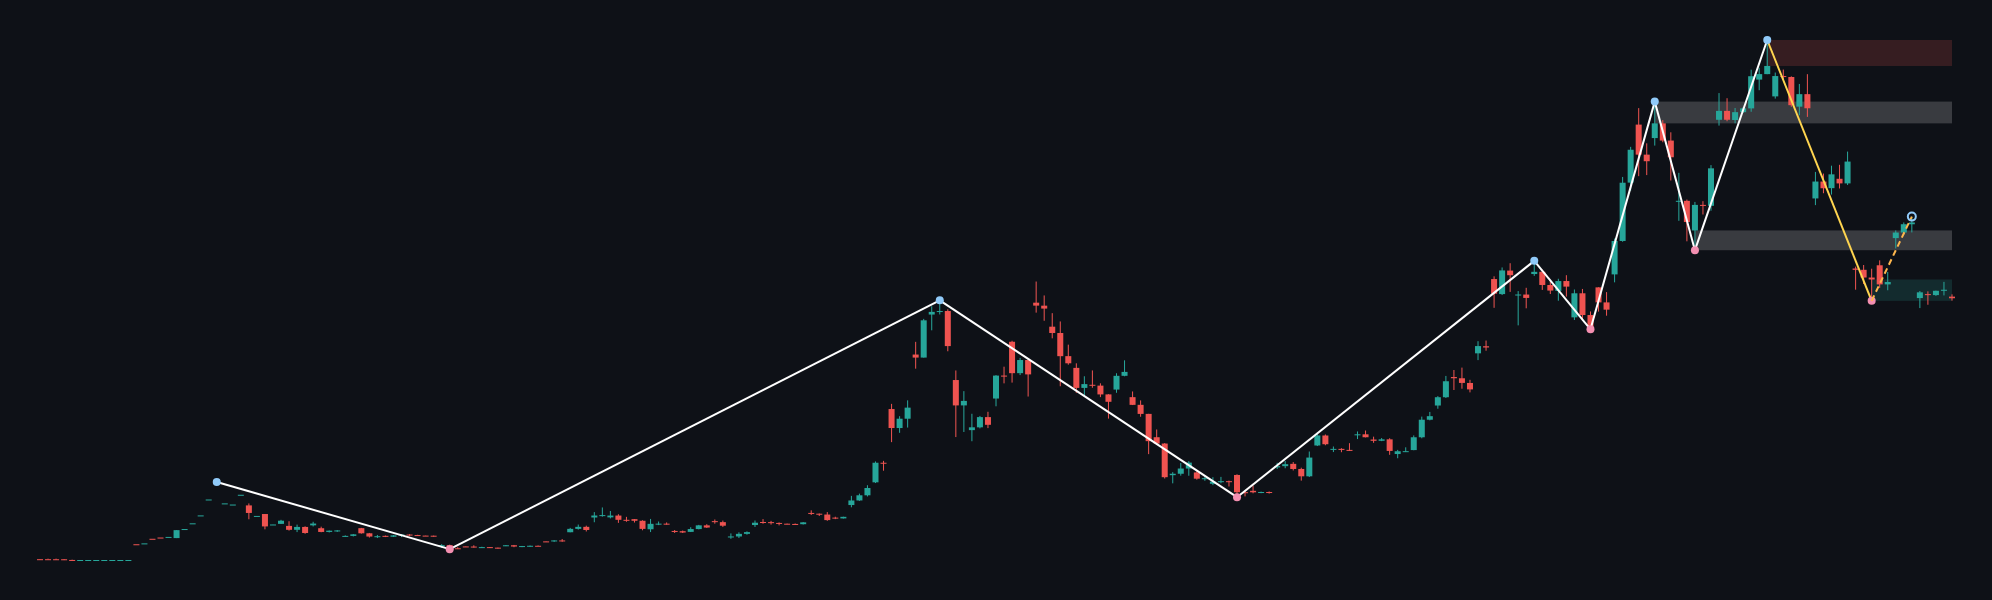
The Weekly market structure is classified as sideways, with no confirmed structure event. The most recent confirmed swing is a low at 62409.68, which places the latest Weekly close close to the upper portion of the 62409.68–67488.06 support zone. This area is therefore the principal higher-timeframe reference for assessing whether consolidation can persist.
Above the market, the major Weekly resistance zone is 118374.30–124563.72. The Weekly chart also marks 104703.29–109879.73 as a broken-retest support zone and 74471.48–79173.64 as a broken-retest resistance zone. The Weekly ATR is 7477.78, indicating that the broader frame has materially wider movement potential than the Daily frame.
The Weekly report does not provide EMA values, crossover information, or a Weekly Fibonacci reading. Those elements are therefore not determinable from the deterministic data. The higher timeframe permits both continuation of the range and a directional move away from the 62409.68–67488.06 area, but it does not establish a confirmed bullish or bearish structure break.
Main-frame structure — Daily
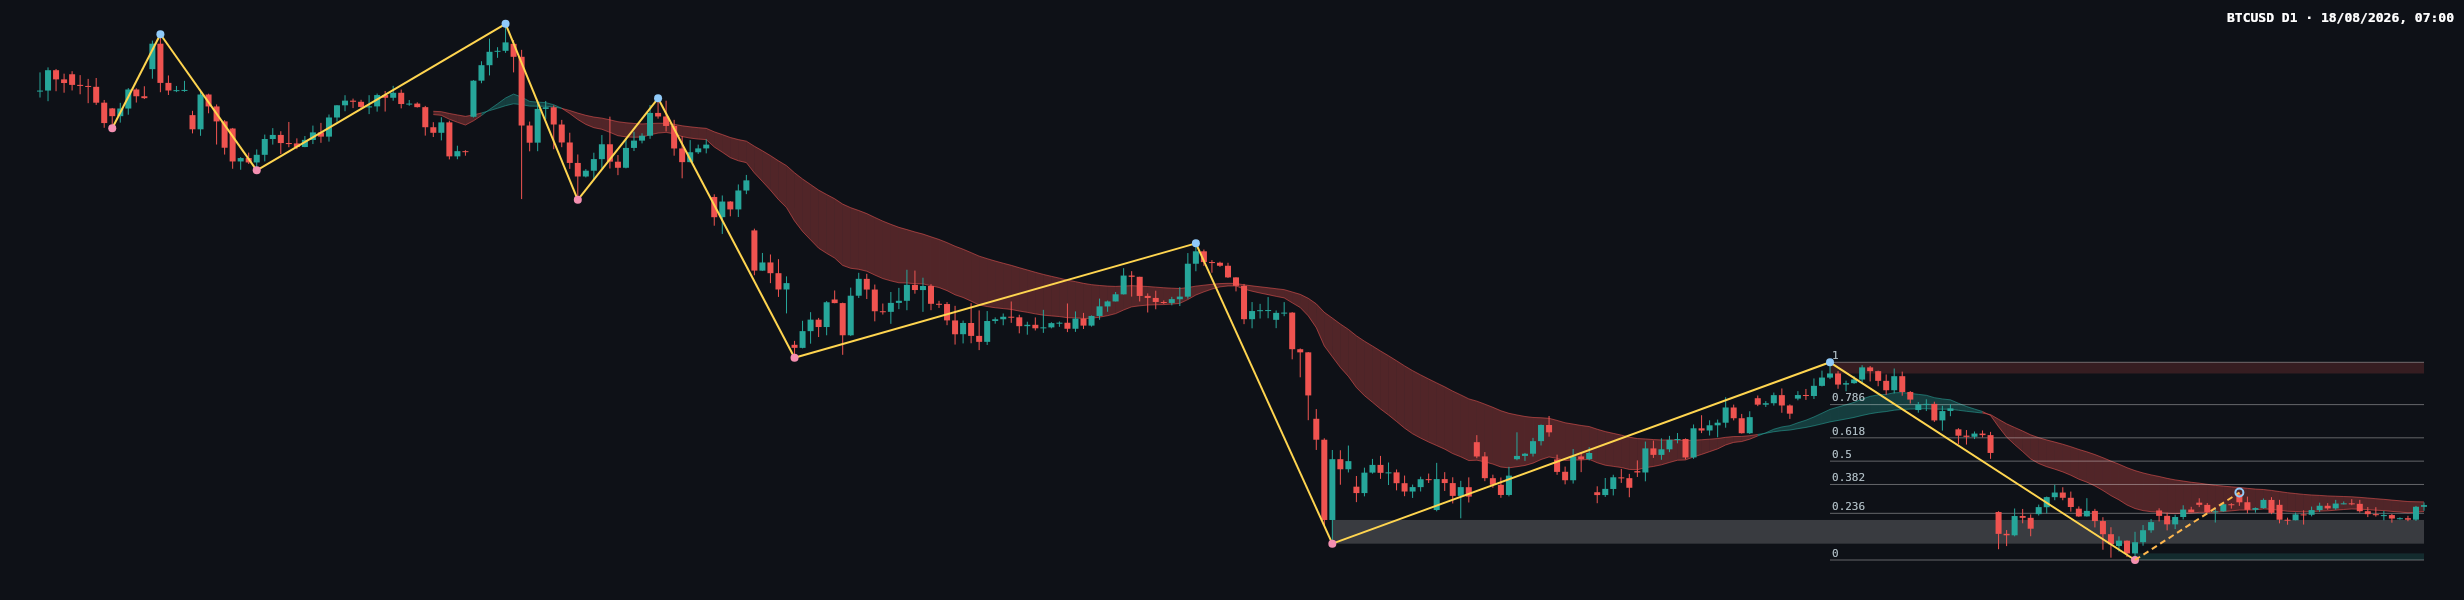
The Daily main trend is down and firm, while the sub-trend is up. This misalignment is consistent with a counter-trend recovery or pullback within the broader Daily decline; the report records no structure event. The most recent confirmed Daily swing is a low at 57704.79.
The closest Daily resistance zone is 81426.29–82844.58. The current price is below this zone, leaving it as the main upside structural barrier. The Daily support zone is 57704.79–58541.32, while 59783.75–62793.85 is identified as a broken-retest resistance zone. With the latest close at 64680.37, price is above that broken-retest area but remains below the major resistance zone.
The latest completed Dow leg defines the following Fibonacci references: 0 at 57704.79, 0.236 at 63637.78, 0.382 at 67308.19, 0.5 at 70274.69, 0.618 at 73241.18, 0.786 at 77464.66, and 1 at 82844.58. The current retracement ratio is 0.277, placing price between the 0.236 and 0.382 references. This is a developing recovery zone rather than evidence of a completed reversal.
The deterministic report does not specify the precise body, wick, close location, or range of the most recent candles. Candle classification, volume confirmation, and momentum divergence are therefore not determinable from the report. The available structural evidence still favors caution: the Daily recovery is constructive above 59783.75–62793.85, but the main trend remains down until resistance is overcome.
Key levels
| Reference | Zone or level | Technical role |
|---|---|---|
| Daily resistance | 81426.29–82844.58 | Main upside barrier and upper Fibonacci endpoint |
| Daily Fibonacci | 67308.19 | 0.382 retracement reference |
| Daily Fibonacci | 63637.78 | 0.236 retracement reference |
| Weekly support | 62409.68–67488.06 | Higher-timeframe consolidation zone |
| Daily broken-retest zone | 59783.75–62793.85 | Former resistance now requiring acceptance or rejection |
| Daily support | 57704.79–58541.32 | Daily swing-low support area |
| Weekly broken-retest resistance | 74471.48–79173.64 | Intermediate higher-timeframe barrier |
Scenarios
Bullish scenario
If Daily price continues to hold above 59783.75–62793.85 and advances through the 0.382 Fibonacci reference at 67308.19, the recovery could extend toward the 70274.69, 73241.18, and 74471.48–79173.64 reference areas. A sustained move through 81426.29–82844.58 would represent a more meaningful challenge to the prevailing Daily downtrend. This scenario is invalidated if price loses the 59783.75–62793.85 zone and cannot reclaim it.
Range or consolidation scenario
If price remains between the 63637.78 and 67308.19 Fibonacci references, BTCUSD may continue consolidating above the Daily broken-retest zone while the Weekly market stays sideways. Repeated rejection near 67308.19 would keep the recovery contained, while holding above 63637.78 would preserve the upward Daily sub-trend. This scenario is invalidated by a decisive move beyond the surrounding references.
Bearish scenario
If price falls back below 59783.75–62793.85, the broken-retest zone would be rejected and the Daily downtrend would regain stronger control. Follow-through toward 57704.79–58541.32 would then become the next structural reference, with the confirmed swing low at 57704.79 important for judging whether the decline is extending. A sustained break beneath that support zone would weaken the current Weekly support interpretation. This scenario is invalidated by acceptance back above 62793.85 and renewed progress toward 67308.19.
Closing view
The central question is whether BTCUSD can build acceptance above 59783.75–62793.85 and progress through 67308.19, or whether the recovery fails and price returns toward 57704.79–58541.32. The Weekly range argues against premature directional certainty, while the Daily trend keeps bearish risk relevant until the 81426.29–82844.58 resistance zone is challenged and overcome.
#BTCUSD #Bitcoin #DailyAnalysis #PriceAction #DowTheory
Meta description: BTCUSD remains in a Daily downtrend with an upward sub-trend, consolidating above 59783.75–62793.85 and below key resistance.
This article is technical analysis and reference information only, not investment advice. Markets carry risk, and readers are responsible for their own decisions.