
BTCUSD presents a mixed multi-timeframe picture. The weekly chart describes a firm sideways market with an upward sub-trend, while the daily chart remains in a firm downtrend with an upward sub-trend. The latest daily close at 63910.67 is close to the Fibonacci level at 63637.78, leaving that area as an important test of whether the current rebound can develop further.
| Metric | Value |
|---|---|
| Weekly last closed price | 64910.12 |
| Daily last closed price | 63910.67 |
| Weekly trend | Sideways, with an upward sub-trend |
| Daily trend | Down, with an upward sub-trend |
| Daily ATR | 1521.34 |
| Nearest Fibonacci level | 63637.78 |
| Nearest upper resistance zone | 81426.29 – 82844.58 |
| Nearest lower support zone | 57704.79 – 58541.32 |
Higher-Timeframe Context: Weekly Structure
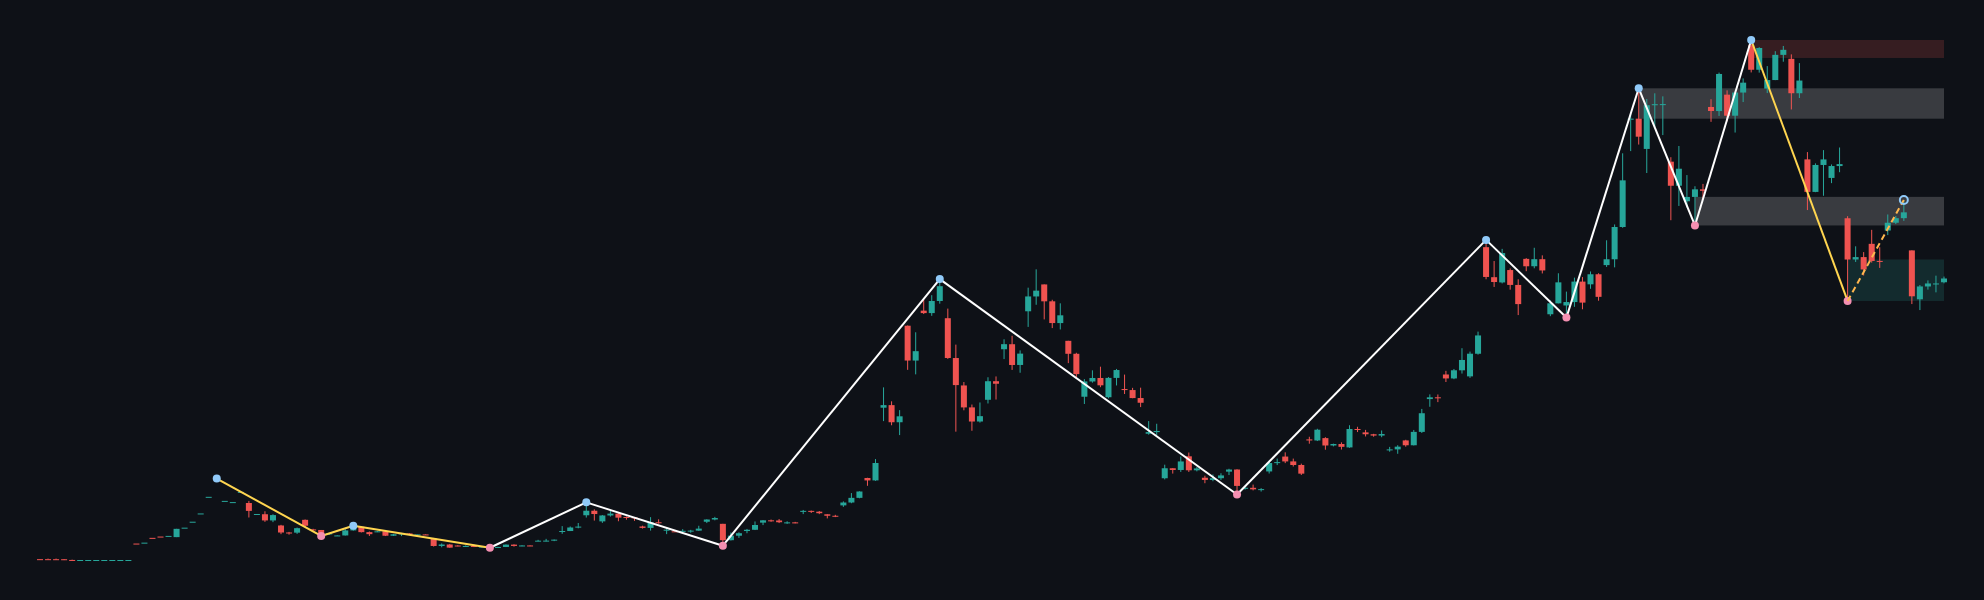
The weekly structure is classified as sideways and firm, with the sub-trend pointing upward. No weekly structure event is recorded, so the chart does not confirm a fresh break in either direction. The most recent confirmed weekly swing is a low at 59783.75, which places the broad 59783.75 – 69241.82 support zone at the centre of the current context.
Price is also trading below the former 101400.28 – 108329.52 support zone, which is marked as a broken-retest area. Above the market, the former 77025.31 – 83539.79 resistance zone is another broken-retest reference, followed by the broader 115263.98 – 119361.53 resistance zone. These areas show that the weekly chart has substantial overhead structure even though its sub-trend remains upward.
The weekly ATR is 8195.10, indicating a materially wider context range than the daily ATR. Exact weekly EMA values are not included in the deterministic report, so their numerical position and spacing are not determinable here. The higher timeframe permits further recovery while price remains within or above the 59783.75 – 69241.82 support area, but it does not yet establish a confirmed bullish structure event.
Main-Frame Structure: Daily Chart
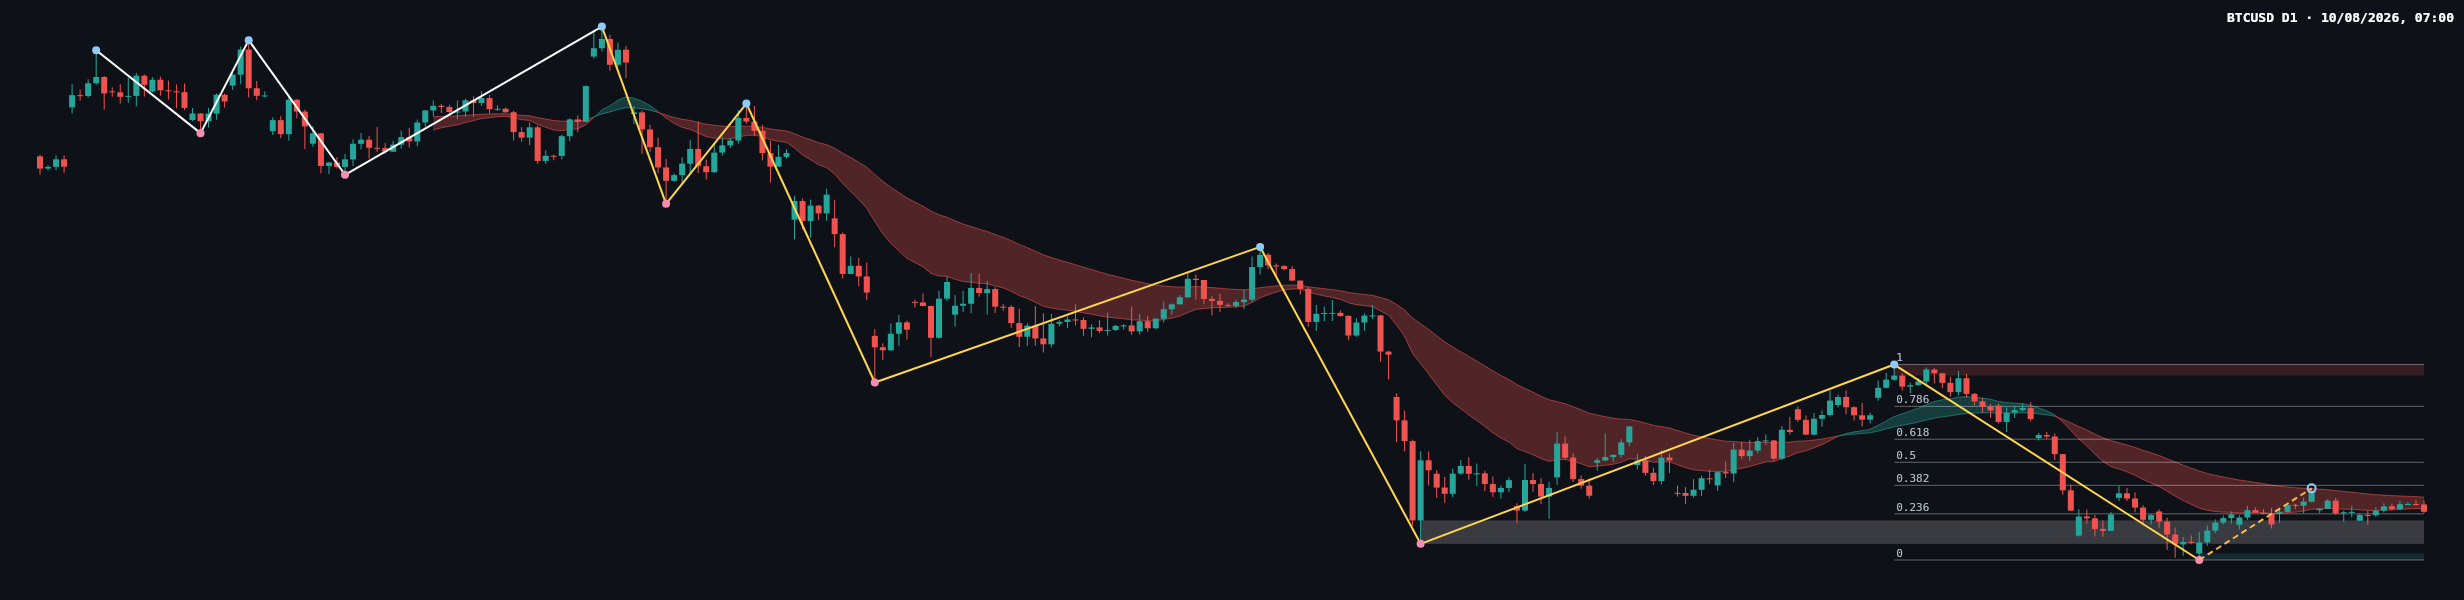
The daily main trend remains down and firm, despite an upward sub-trend. This creates a clear alignment issue with the weekly picture: the daily advance can be treated as a rebound within the larger daily decline unless price begins to reclaim overhead structure. No daily structure event is recorded, and the most recent confirmed daily swing is a low at 57704.79.
The main daily resistance zone is 81426.29 – 82844.58. The lower 59783.75 – 62793.85 area is marked as a broken-retest resistance zone, so its interaction with the current close is important. A sustained move above that region would improve the structure of the rebound, while renewed rejection there would preserve the daily bearish framework.
The latest completed Dow leg runs from 57704.79 to 82844.58. Its Fibonacci references are 63637.78 at 0.236, 67308.19 at 0.382, 70274.69 at 0.5, 73241.18 at 0.618, and 77464.66 at 0.786. The current retracement ratio is 0.247, placing the latest close around the first Fibonacci recovery area rather than near the deeper retracement levels.
The chart shows the latest candles consolidating after a decline, with price remaining close to the lower Fibonacci reference and beneath the visible moving-average ribbon. Exact EMA readings, volume, and momentum values are not provided in the report, so numerical confirmation from those tools is not determinable. Visually, the candle sequence suggests hesitation rather than a confirmed reversal: buyers have defended the lower area, but sellers have not yet lost the broader daily structure.
Key Levels and Candle Interpretation
- 63910.67: latest daily close and the current reference point.
- 63637.78: Fibonacci 0.236 level, currently the closest retracement reference.
- 59783.75 – 62793.85: broken-retest resistance zone on the daily chart.
- 57704.79 – 58541.32: primary daily support zone, containing the latest confirmed swing low.
- 67308.19, 70274.69, 73241.18, and 77464.66: progressively higher Fibonacci recovery references.
- 81426.29 – 82844.58: major daily resistance zone and the upper endpoint of the latest completed Dow leg.
The most recent closing candle is best read in relation to 63637.78 and the nearby broken-retest zone. The chart does not provide a deterministic candle label such as a confirmed pin bar, engulfing pattern, or doji. Its position within the broader consolidation indicates competing pressure: buyers are attempting to hold the Fibonacci area, while sellers retain control as long as price remains beneath the broken-retest resistance and the daily trend remains down.
Conditional Scenarios
Bullish recovery scenario
If BTCUSD holds above 63637.78 and then reclaims the 59783.75 – 62793.85 broken-retest area as support, the rebound would have a stronger structural basis. The next upside references would be 67308.19, 70274.69, and then 73241.18. This scenario would be invalidated by a decisive return below 63637.78, particularly if that move develops into a break of the 57704.79 – 58541.32 support zone.
Bearish continuation scenario
If price fails to hold 63637.78 and sellers push through the 59783.75 – 62793.85 area without reclaiming it, the daily downtrend would remain the dominant framework. Attention would then return to 57704.79 – 58541.32. A clear loss of that support zone would weaken the weekly upward sub-trend as well. This scenario would be challenged if price closes back above the broken-retest resistance area and holds that region on a subsequent test.
Range and failed-breakout scenario
BTCUSD may continue to rotate between the Fibonacci reference at 63637.78 and the broken-retest resistance at 59783.75 – 62793.85, with false breaks on either side. In that case, neither the bullish recovery nor bearish continuation would have sufficient confirmation. The range scenario would be invalidated by sustained acceptance above the broken-retest zone or by a clear break below 57704.79 – 58541.32.
What to Monitor
- Whether 63637.78 continues to act as support.
- Whether the 59783.75 – 62793.85 broken-retest zone is reclaimed or rejected.
- Whether price progresses toward 67308.19 and 70274.69, or instead returns toward 57704.79 – 58541.32.
- Whether a move through either zone receives confirmation from a later close and retest rather than only an intraday excursion.
- Whether the weekly support zone at 59783.75 – 69241.82 continues to contain the market.
The central reading is cautiously balanced. The daily chart still favours sellers because its main trend is down and firm, but the upward sub-trend and weekly support context leave room for a recovery if 63637.78 holds and the broken-retest resistance zone is reclaimed. Conversely, a failure at that Fibonacci reference would restore attention to 57704.79 – 58541.32.
#BTCUSD #Bitcoin #TechnicalAnalysis #PriceAction #DowTheory
Meta description: BTCUSD daily analysis: price tests 63637.78 Fibonacci support while 59783.75–62793.85 and 81426.29–82844.58 define resistance.
This article is technical analysis and reference information only, not investment advice. Markets carry risk, and readers are responsible for their own decisions.