
BTCUSD closed at 64910.12. The higher-timeframe picture is sideways with an upward sub-trend, while the daily frame remains in a firm downtrend with an upward sub-trend. The key question is whether the recovery can hold above the broken-retest area at 59783.75 – 62793.85 and progress through the Fibonacci region above current price, or whether resistance reasserts control.
| Metric | Value |
|---|---|
| Last closed price | 64910.12 |
| Weekly trend | Sideways; sub-trend up |
| Daily trend | Down; sub-trend up |
| Weekly ATR | 8306.96 |
| Daily ATR | 1548.90 |
| Nearest resistance | 81426.29 – 82844.58 |
| Nearest support | 59783.75 – 62793.85 |
| Active Fibonacci retracement | 0.287 |
Higher-timeframe context
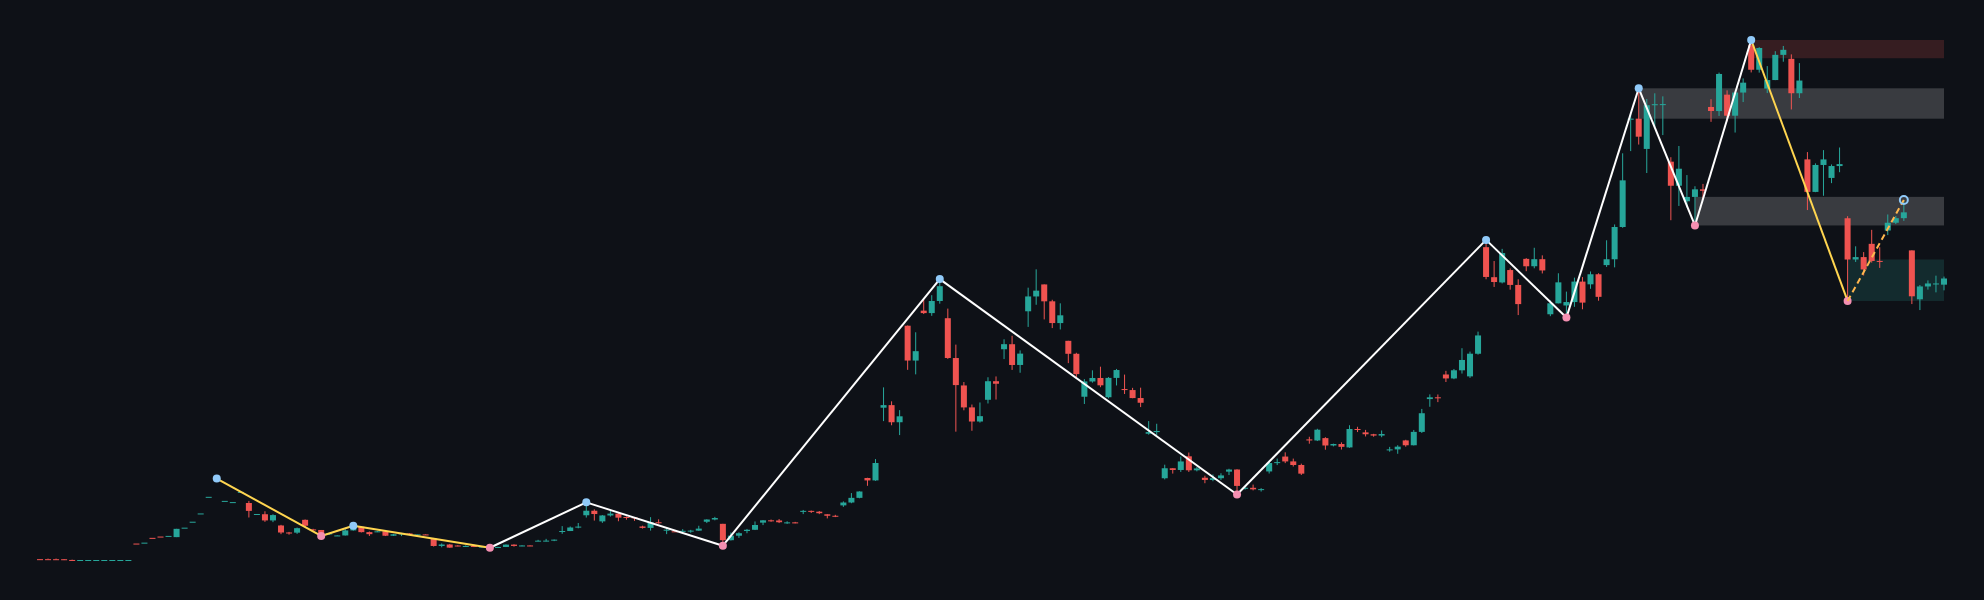
The weekly main trend is sideways, described as firm, while the sub-trend is up. The most recent confirmed weekly swing is a low at 59783.75, and the report identifies no current structure event. This leaves the broader market in a range-oriented condition rather than confirming a fresh directional break.
Price is below the weekly resistance zone at 115208.05 – 119361.53 and is trading within the broad weekly support zone at 59783.75 – 69241.82. The other marked areas are a broken-retest support zone at 101400.28 – 108329.52 and a broken-retest resistance zone at 77025.31 – 83539.79. The weekly ATR is 8306.96, which indicates that the higher-timeframe zones should be treated as broad areas rather than precise single-price barriers.
The weekly report does not provide Fibonacci levels or numerical EMA readings. Their exact interaction is therefore not determinable from the deterministic data. The weekly structure permits recovery while price holds the broad support area, but it does not confirm a sustained bullish reversal.
Main-frame structure
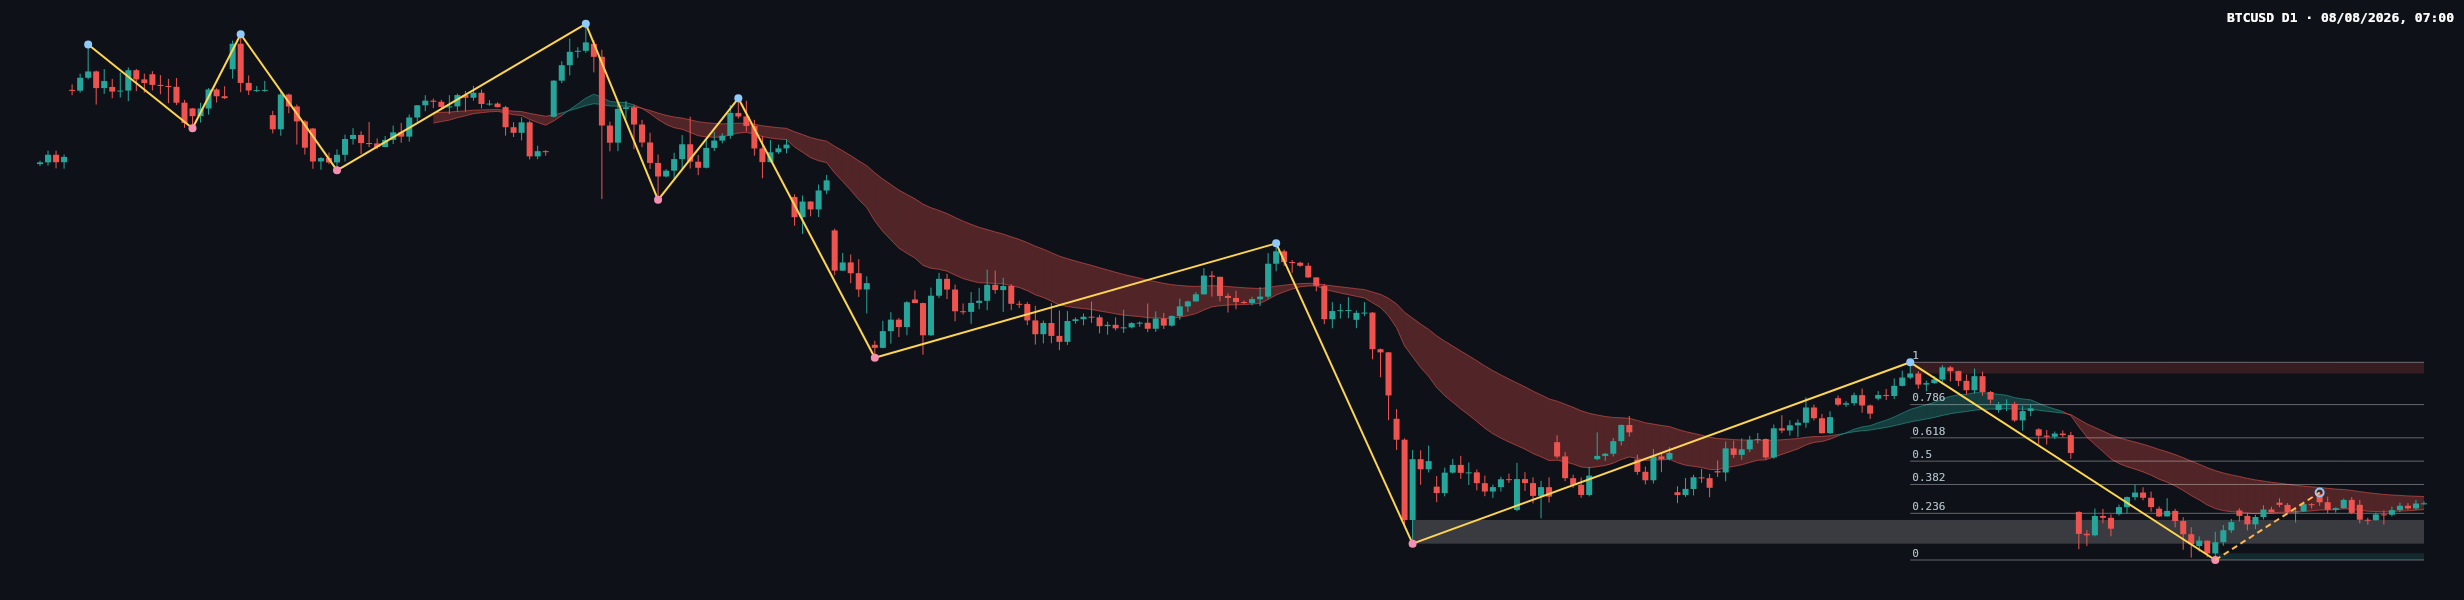
The daily main trend is down and firm, while the sub-trend is up. This is not fully aligned with the weekly sideways framework: the daily advance can be read as a counter-trend recovery inside a larger uncertain structure. No daily structure event is reported, and the most recent confirmed daily swing is a low at 57704.79.
The daily resistance zone is 81426.29 – 82844.58. Below the current close, the principal daily support zone is 57704.79 – 58541.32, while 59783.75 – 62793.85 is marked as broken-retest resistance. The current retracement ratio is 0.287. This places the market between the listed Fibonacci levels at 0.236, corresponding to 63637.78, and 0.382, corresponding to 67308.19.
The remaining Fibonacci references are 0.5 at 70274.69, 0.618 at 73241.18, 0.786 at 77464.66, and 1 at 82844.58. A move through the higher retracement levels would improve the recovery structure, but the daily downtrend remains the controlling framework until resistance is overcome and structure confirms otherwise.
Key levels and recent price action
The immediate decision area is the Fibonacci band between 63637.78 and 67308.19. Holding above the lower reference would preserve the upward sub-trend, while rejection below the upper reference would show that sellers remain active during the recovery.
The chart shows a prior advance into the region of 81426.29 – 82844.58, followed by a decline toward the lower daily support area. The latest candles appear compressed near the current close, suggesting a balance between buyers attempting to stabilize and sellers defending the recovery. Exact candle classifications, volume readings, and EMA values are not provided in the deterministic report, so they are not determinable here.
The daily ATR is 1548.90. That figure provides context for the scale of ordinary daily movement, but it does not establish a directional outcome. The most recent close remains above the daily support zone at 57704.79 – 58541.32 and above the broken-retest area at 59783.75 – 62793.85, yet the broader daily trend is still down.
Scenarios
- Bullish recovery scenario: If price establishes itself above 67308.19, the upward sub-trend could extend toward the next Fibonacci references at 70274.69 and 73241.18. The scenario would be weakened if price falls back below 63637.78, because that would indicate failure to hold the recovery band.
- Range scenario: If price remains between 63637.78 and 67308.19, consolidation would remain the clearest interpretation. A failure to leave this area would keep the weekly sideways structure and daily counter-trend recovery in force. A sustained move outside this band would invalidate the range interpretation.
- Bearish continuation scenario: If price breaks back below 63637.78 and loses the broken-retest support area at 59783.75 – 62793.85, sellers could retest the daily support zone at 57704.79 – 58541.32. A sustained recovery above 67308.19 would invalidate this immediate bearish continuation view.
What to monitor
- Resistance: 67308.19, followed by 70274.69, 73241.18, and the daily zone at 81426.29 – 82844.58.
- Support: 63637.78, the broken-retest area at 59783.75 – 62793.85, and the daily support zone at 57704.79 – 58541.32.
- Confirmation: A sustained daily close beyond the relevant Fibonacci boundary, followed by acceptance rather than a brief excursion, would provide stronger evidence for either scenario.
- Traps: A false break above 67308.19 could trap late buyers, while a brief dip below 63637.78 could become a liquidity sweep if the support area quickly holds.
- Risk framework: Volatility can expand around major news and liquidity transitions. General risk principles include avoiding excessive exposure, planning invalidation before acting, and allowing for movement consistent with the daily ATR of 1548.90.
Summary
- BTCUSD closed at 64910.12 inside the weekly support zone at 59783.75 – 69241.82.
- The weekly structure is sideways with an upward sub-trend, while the daily trend remains firmly down.
- The current retracement ratio is 0.287, between 0.236 at 63637.78 and 0.382 at 67308.19.
- Holding above 63637.78 keeps the recovery scenario active; losing the broader support area would favor bearish continuation.
The single most important issue is whether price can establish acceptance above 67308.19 without losing 63637.78.
#BTCUSD #Bitcoin #TechnicalAnalysis #PriceAction #CryptoMarkets
Meta description: BTCUSD analysis: daily downtrend, weekly range, Fibonacci levels, support at 59783.75 – 62793.85, and resistance at 81426.29 – 82844.58.
This article is technical analysis and reference information only, not investment advice. Markets carry risk, and readers are responsible for their own decisions.