
BTCUSD is presenting a mixed multi-timeframe picture. The weekly framework remains firmly bearish after a break of structure at 65062.28, while the daily chart is attempting a counter-trend recovery from the broader support area at 58083.13–58991.87. The latest daily close is 64601.42, leaving price close to the Fibonacci retracement level at 63926.83 and beneath the higher-timeframe support zone at 65062.28–68962.46.
| Metric | Value |
|---|---|
| Latest daily close | 64601.42 |
| Weekly close | 62758.29 |
| Weekly trend | Down, firm |
| Daily trend | Down, firm; sub-trend up |
| Nearest Fibonacci reference | 63926.83, ratio 0.236 |
| Daily resistance | 59783.75–62793.85 broken-retest zone; higher resistance at 81426.29–82844.58 |
| Daily support | 58083.13–58991.87 |
Higher-timeframe context
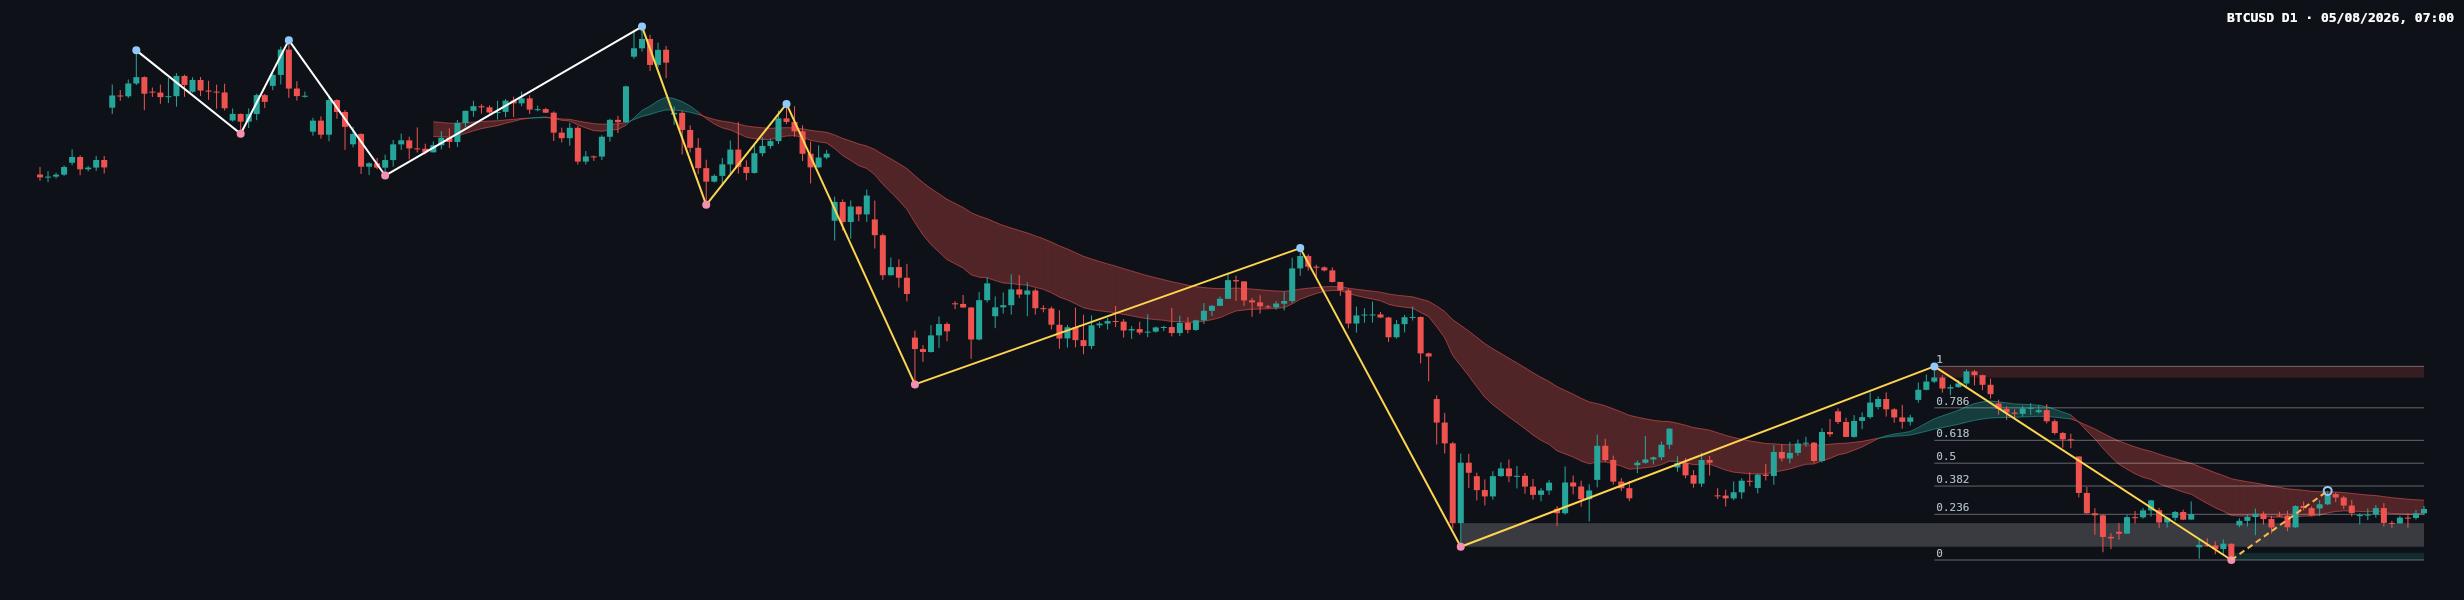
The weekly chart defines the dominant risk direction as bearish. Its main trend and sub-trend are both down, and the reported break of structure occurred at 65062.28. The most recent confirmed weekly swing is a high at 79513.01, which places the market within a sequence of lower-structure pressure rather than a confirmed broad reversal.
Weekly price is associated with a support zone at 65062.28–68962.46 and resistance zones at 75612.83–79513.01 and 74364.56–79533.38. The latter is identified as a broken-retest area. With the weekly last closed price at 62758.29, the market is below the reported weekly support zone and below the broken structure level. That keeps rallies vulnerable to rejection until price can recover those areas.
The weekly ATR is 7800.35, indicating a materially wider context range than the daily ATR of 1817.49. This difference matters because a daily recovery can develop inside a larger weekly decline without immediately changing the higher-timeframe trend.
Main-frame structure
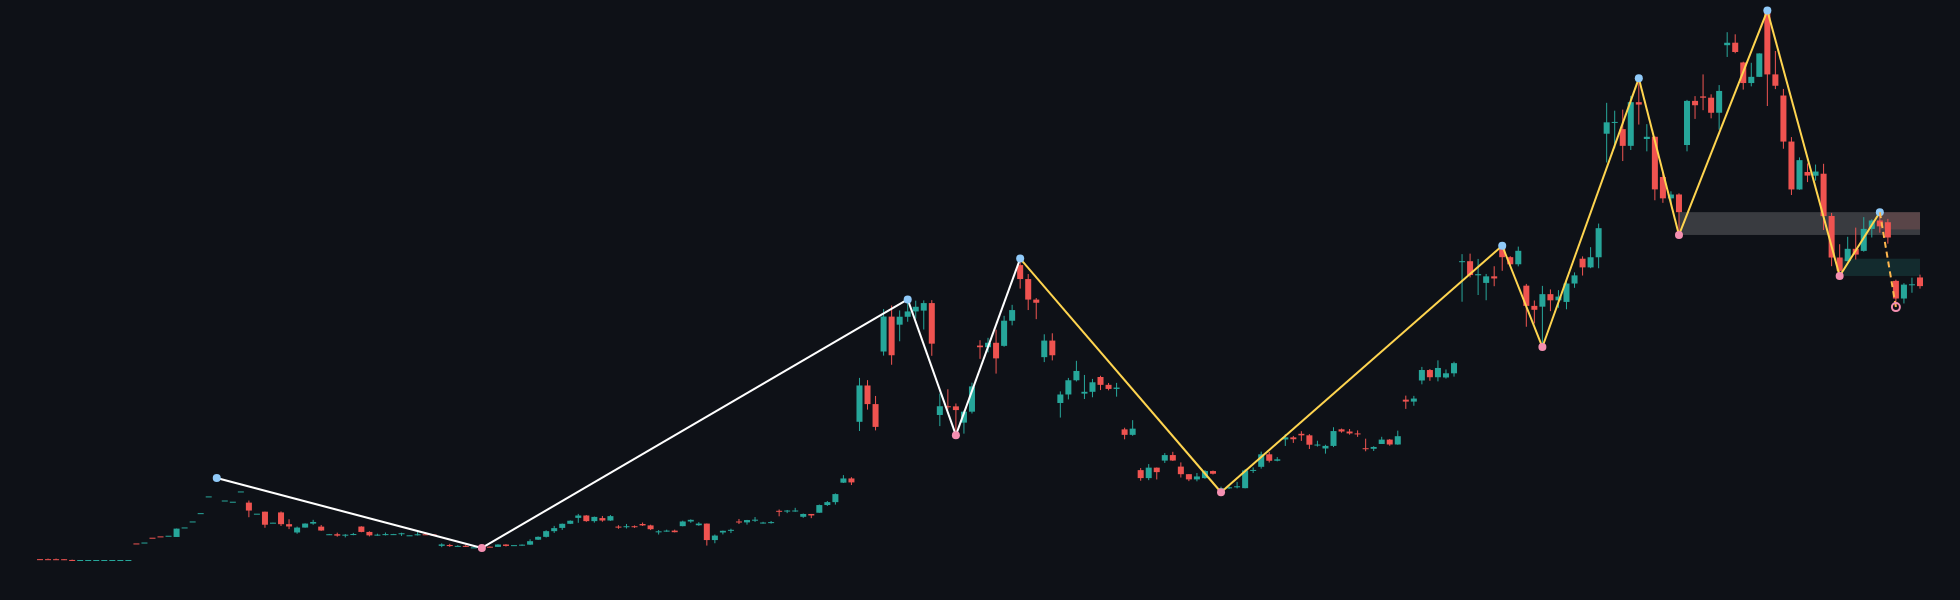
The daily chart is still classified as down, firm, although its sub-trend is up. This is a misalignment with the weekly chart and is therefore best treated as a developing pullback or recovery attempt rather than a confirmed reversal. The daily report shows no current structure event. The most recent confirmed daily swing is a low at 58083.13.
The daily support zone is 58083.13–58991.87. Above current price, the broken-retest area is 59783.75–62793.85, while the larger resistance zone is 81426.29–82844.58. Because the latest close is 64601.42, price has moved above the daily broken-retest band but remains below the first major Fibonacci resistance reference at 67542.00.
The latest completed Dow leg runs from 58083.13 to 82844.58. Its reported Fibonacci references are 63926.83 at ratio 0.236, 67542.00 at ratio 0.382, 70463.86 at ratio 0.5, 73385.71 at ratio 0.618, and 77545.63 at ratio 0.786. The current retracement ratio is 0.263, placing the market near the lower Fibonacci recovery area rather than deep within the retracement.
Key levels and recent price behaviour
The most important nearby reference is 63926.83. Holding above this level would preserve the shallow recovery structure visible on the daily chart. A sustained move toward 67542.00 would show that buyers are extending the pullback into a deeper retracement area. The next Fibonacci references are 70463.86 and 73385.71, but a move toward them would still face the unresolved weekly downtrend.
On the bearish side, renewed weakness below 63926.83 would weaken the current daily sub-trend. A deeper decline would bring attention back to the daily support zone at 58083.13–58991.87. The weekly structure level at 65062.28 is also important: it now sits between the current close and the weekly support zone, so failure to reclaim it would leave the broader breakdown intact.
The chart shows a sequence of recent daily candles consolidating after the rebound from the lower support area. The exact candle classifications, body-to-wick measurements, and session-by-session ranges are not determinable from the deterministic report. Visually, the sequence reflects an attempt by buyers to build a higher short-term base, but the recovery has not yet produced a reported daily break of structure. That makes the latest candle more useful as confirmation of acceptance or rejection around the nearby levels than as an isolated reversal signal.
Conditional scenarios
Primary scenario: recovery remains contained
- Trigger condition: price fails to establish acceptance above the weekly structure level at 65062.28 and remains capped within or below 65062.28–68962.46.
- Target zone: a return toward the daily broken-retest area at 59783.75–62793.85, with the lower support zone at 58083.13–58991.87 becoming relevant if selling pressure increases.
- Invalidation: sustained recovery above 68962.46 would weaken this contained-recovery view.
- Relative likelihood: primary, because the weekly trend remains down and the daily chart has no reported structure break.
Secondary scenario: bullish retracement extends
- Trigger condition: price holds above 63926.83 and then clears 67542.00, demonstrating progress beyond the shallow retracement.
- Target zone: successive Fibonacci references at 70463.86, 73385.71, and 77545.63, with the weekly resistance areas at 75612.83–79513.01 and 74364.56–79533.38 requiring particular attention.
- Invalidation: a renewed close below 63926.83 would undermine the extension scenario.
- Relative likelihood: secondary, as it would represent a deeper counter-trend move against the firm weekly direction.
Risk scenario: support gives way
- Trigger condition: price loses the daily support zone at 58083.13–58991.87.
- Target zone: further downside is not determinable from the reported levels.
- Invalidation: recovery back above 58991.87 would weaken the immediate breakdown signal.
- Relative likelihood: a lower-frequency but important risk scenario because it would confirm that the daily recovery failed at the larger structural level.
What to monitor
- Watch the interaction between 63926.83, 65062.28, and 67542.00 for evidence of acceptance or rejection.
- Observe whether the former daily broken-retest area at 59783.75–62793.85 acts as support or becomes an overhead barrier again.
- For the broader bearish structure, monitor the weekly resistance areas at 75612.83–79513.01 and 74364.56–79533.38.
- For downside risk, the key demand area remains 58083.13–58991.87.
- Confirmation should come from a sustained close beyond the relevant level and subsequent price acceptance, rather than from a brief intraday breach.
- The report contains no news or economic-calendar schedule, so event-specific timing is not determinable here. Volatility should nevertheless be considered alongside the daily ATR of 1817.49 and weekly ATR of 7800.35.
Summary
- The weekly trend is down and firm after a break at 65062.28.
- The daily sub-trend is up, but no daily structure event has been reported.
- 63926.83 is the nearest Fibonacci reference and a key test for the recovery.
- A move above 67542.00 would strengthen the bullish retracement case, while failure around 65062.28–68962.46 would favour renewed weakness.
- The major downside reference is 58083.13–58991.87.
The single most important issue is whether BTCUSD can convert the area around 63926.83–67542.00 into accepted support while the weekly structure remains bearish.
#BTCUSD #Bitcoin #DailyAnalysis #PriceAction #TechnicalAnalysis
Meta description: BTCUSD daily analysis: assess the weekly downtrend, daily recovery, Fibonacci levels, support zones, resistance zones, and conditional scenarios.
This article is technical analysis and reference information only, not investment advice. Markets carry risk, and readers are responsible for their own decisions.