
BTCUSD presents a mixed but still cautious picture across timeframes. The weekly chart remains firmly bearish after a break of structure at 65062.28, while the daily chart has an upward sub-trend within a broader downtrend. The most notable feature is that the daily close at 63502.78 is sitting just above the broken-retest area at 59783.75–62793.85, but remains below the weekly support zone at 65062.28–68962.46.
Higher-timeframe context — Weekly
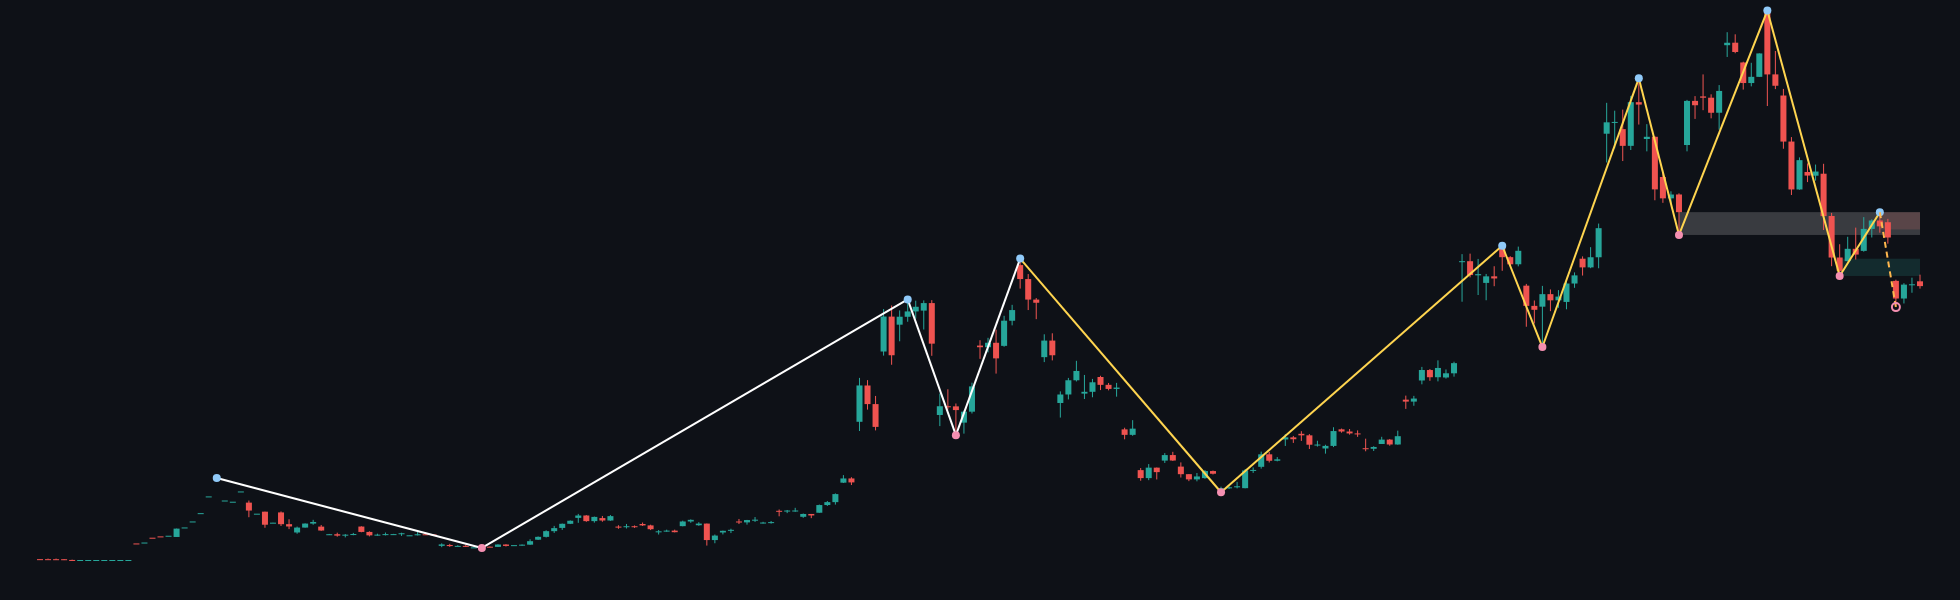
The weekly structure is bearish. The main trend and sub-trend are both down, and the reported break of structure occurred at 65062.28. The most recent confirmed weekly swing is a high at 79513.01, leaving the broader structure vulnerable while price remains below the broken level.
The weekly support zone is marked at 65062.28–68962.46. Because the last closed weekly price is 62758.29, this area is overhead rather than beneath the market. A sustained recovery into that zone would test whether former support can become resistance. Above it, the weekly resistance zones are 75612.83–79513.01 and the broken-retest area at 74364.56–79533.38. The latest confirmed swing high at 79513.01 is therefore an important reference for any larger recovery.
The weekly ATR is 7800.35, indicating a materially wider context range than the daily ATR of 1821.39. Exact weekly EMA values, spacing and crossover status are not determinable from the deterministic report, so the moving-average relationship should not be overstated.
The higher-timeframe conclusion is conditional: the weekly chart permits a recovery only if price can reclaim and hold the 65062.28–68962.46 area. Until that happens, the dominant directional framework remains bearish.
Main-frame structure — Daily
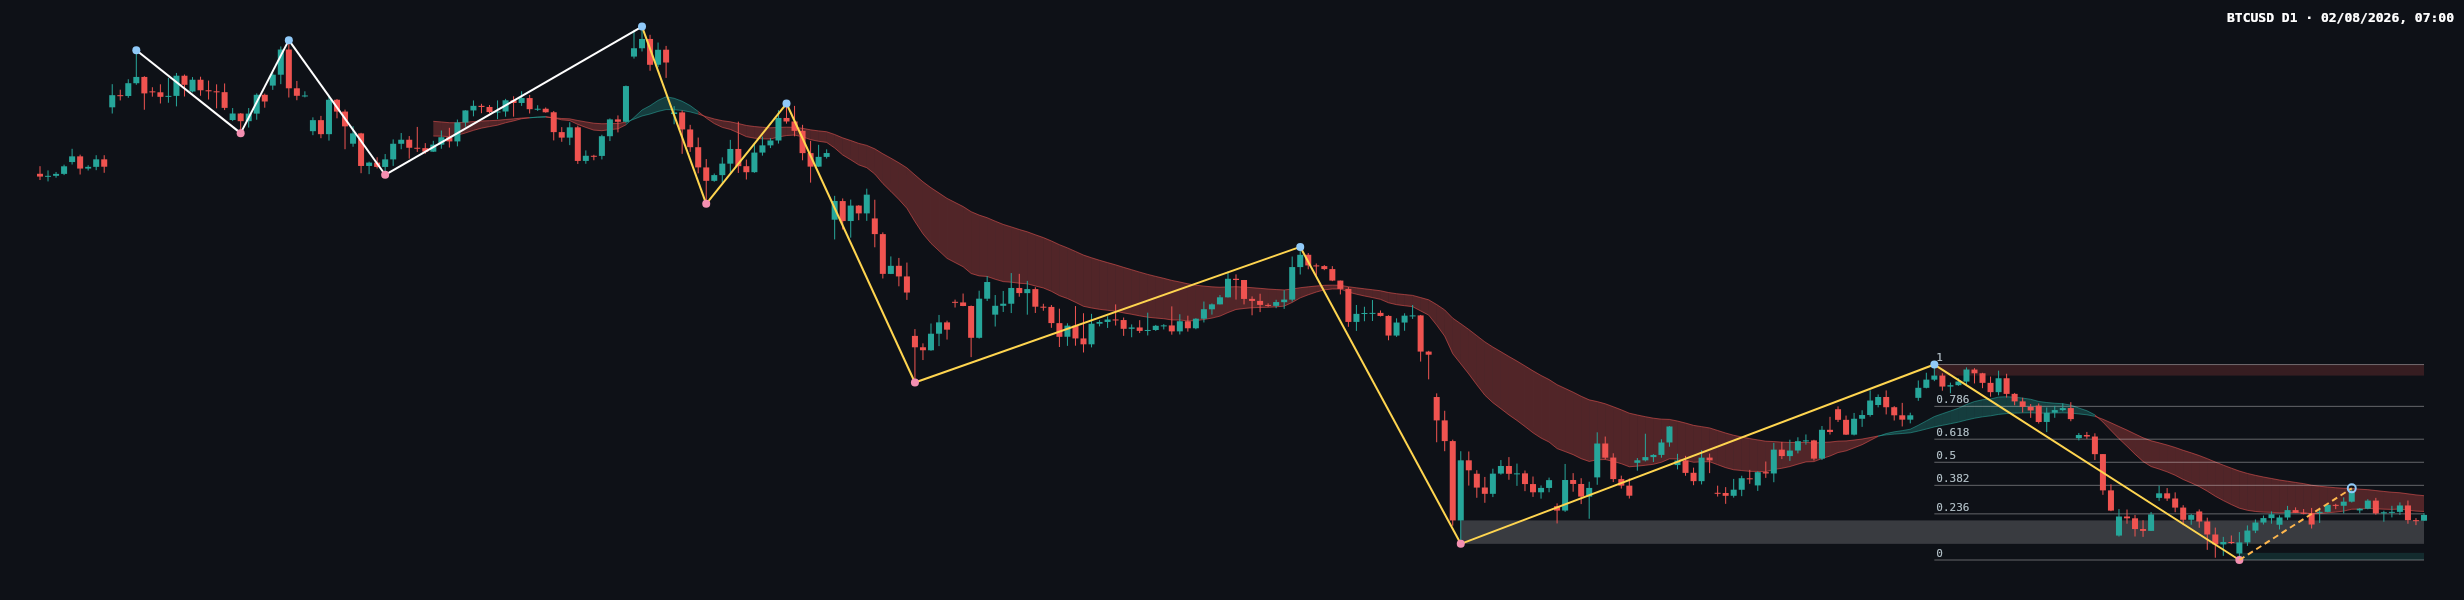
The daily frame also records a main trend that is down, but its sub-trend is up. This disagreement with the weekly trend is consistent with a counter-trend recovery or pullback rather than a confirmed reversal. The daily report identifies no current structure event, and the most recent confirmed swing is a low at 57704.79.
The daily support zone is 57704.79–58615.49. The daily resistance zone at 81426.29–82844.58 is considerably higher and contains the upper endpoint of the latest completed Fibonacci leg. A nearer reference is the broken-retest zone at 59783.75–62793.85. With the last daily close at 63502.78, price is above that zone but has not established a new daily structure event.
The latest completed Dow leg runs from 57704.79 to 82844.58. Its Fibonacci references are 63637.78 at 0.236, 67308.19 at 0.382, 70274.69 at 0.5, 73241.18 at 0.618, and 77464.66 at 0.786. The current retracement ratio is 0.231, placing the market close to the 0.236 reference at 63637.78.
The chart displays moving-average bands, but exact EMA values are not included in the report. Their precise slope, spacing and crossover status are therefore not determinable from the permitted data.
Key levels and the latest closing candle
The latest daily close is 63502.78. It is positioned just below the 63637.78 Fibonacci reference and above the broken-retest zone at 59783.75–62793.85. This places the close at a technical decision point: buyers have defended the area above the former resistance zone, but they have not yet demonstrated a confirmed break through the next Fibonacci reference.
The exact candle classification, wick proportions and close location within the candle range are not determinable from the deterministic report. The chart image suggests a compact consolidation near the recent recovery area, but this visual observation should be treated cautiously because no candle-range measurements are supplied.
From a price-action perspective, a daily close above 63637.78 would improve the case for continuation toward 67308.19. Failure to sustain above the broken-retest area, particularly a return below 62793.85, would weaken the daily recovery and refocus attention on 57704.79–58615.49.
Conditional scenarios
- Bullish scenario: If BTCUSD reclaims 63637.78 and then holds above the broken-retest area at 59783.75–62793.85, the daily recovery could extend toward 67308.19 and potentially 70274.69. This scenario would be invalidated by a decisive return below 62793.85. A probability percentage is not determinable from the report.
- Bearish scenario: If price fails around 63637.78 and breaks back below 62793.85, sellers could press toward the weekly break level at 65062.28 in reverse reference terms and, more importantly, toward daily support at 57704.79–58615.49 if weakness persists. The scenario would be weakened by a sustained recovery above 67308.19. A probability percentage is not determinable from the report.
- Higher-timeframe recovery scenario: If price reclaims the weekly support zone at 65062.28–68962.46 and converts it into support, the larger bearish structure would face a stronger challenge, with 74364.56–79533.38 and 75612.83–79513.01 as higher resistance references. Failure to hold above 65062.28 would invalidate this recovery interpretation. A probability percentage is not determinable from the report.
The current bias leans cautiously bearish on the higher timeframe and conditionally constructive on the daily timeframe, with the key near-term test concentrated around 63637.78 and 62793.85.
Key considerations
- Resistance: Monitor 63637.78, 67308.19, 70274.69, 73241.18, 74364.56–79533.38, 75612.83–79513.01, and 81426.29–82844.58.
- Support: The principal daily demand reference is 57704.79–58615.49. The broken-retest area at 59783.75–62793.85 is also important because it can act as support or resistance depending on the next sustained close.
- Confirmation: The bullish case requires acceptance above 63637.78 and evidence that 59783.75–62793.85 is holding beneath price. The bearish case requires rejection near 63637.78 followed by a loss of 62793.85.
- Traps: A brief move above 63637.78 without follow-through could represent a false breakout. Conversely, a temporary dip below 62793.85 that quickly recovers could be a liquidity sweep rather than a confirmed bearish continuation.
- Volatility: The weekly ATR is 7800.35, while the daily ATR is 1821.39. These figures argue for keeping the two timeframe ranges distinct when interpreting price movement.
- Fundamental monitoring: No news or economic-calendar schedule was supplied with the report. Traders may nevertheless monitor DXY, US ten-year yields, CPI, NFP, FOMC communications, Fed speakers and geopolitical headlines for volatility catalysts.
Summary
- The weekly trend is firmly down after the break at 65062.28.
- The daily sub-trend is up, but no daily structure event has been reported.
- The immediate Fibonacci test is 63637.78, corresponding to 0.236.
- A sustained move above 63637.78 would expose 67308.19 and 70274.69.
- A loss of 62793.85 would refocus attention on 57704.79–58615.49.
The single most important thing today is whether price can hold above 62793.85 while reclaiming 63637.78, or instead falls back into the broken-retest area.
Hashtags: #BTCUSD #BitcoinAnalysis #PriceAction #DowTheory #TechnicalAnalysis
Meta description: BTCUSD remains weekly bearish while the daily frame recovers. Watch 63637.78, 62793.85 and 57704.79–58615.49.
This article is technical analysis and reference information only, not investment advice. Markets carry risk, and readers are responsible for their own decisions.