
XAU/USD is showing a clear divergence between timeframes. The weekly structure remains firmly upward, with the last closed price at 4604.083, while the daily frame has recently turned upward from a broader decline and closed at 4623.974. The most notable development is the daily change of character after the break of 4382.441.
Higher-timeframe context
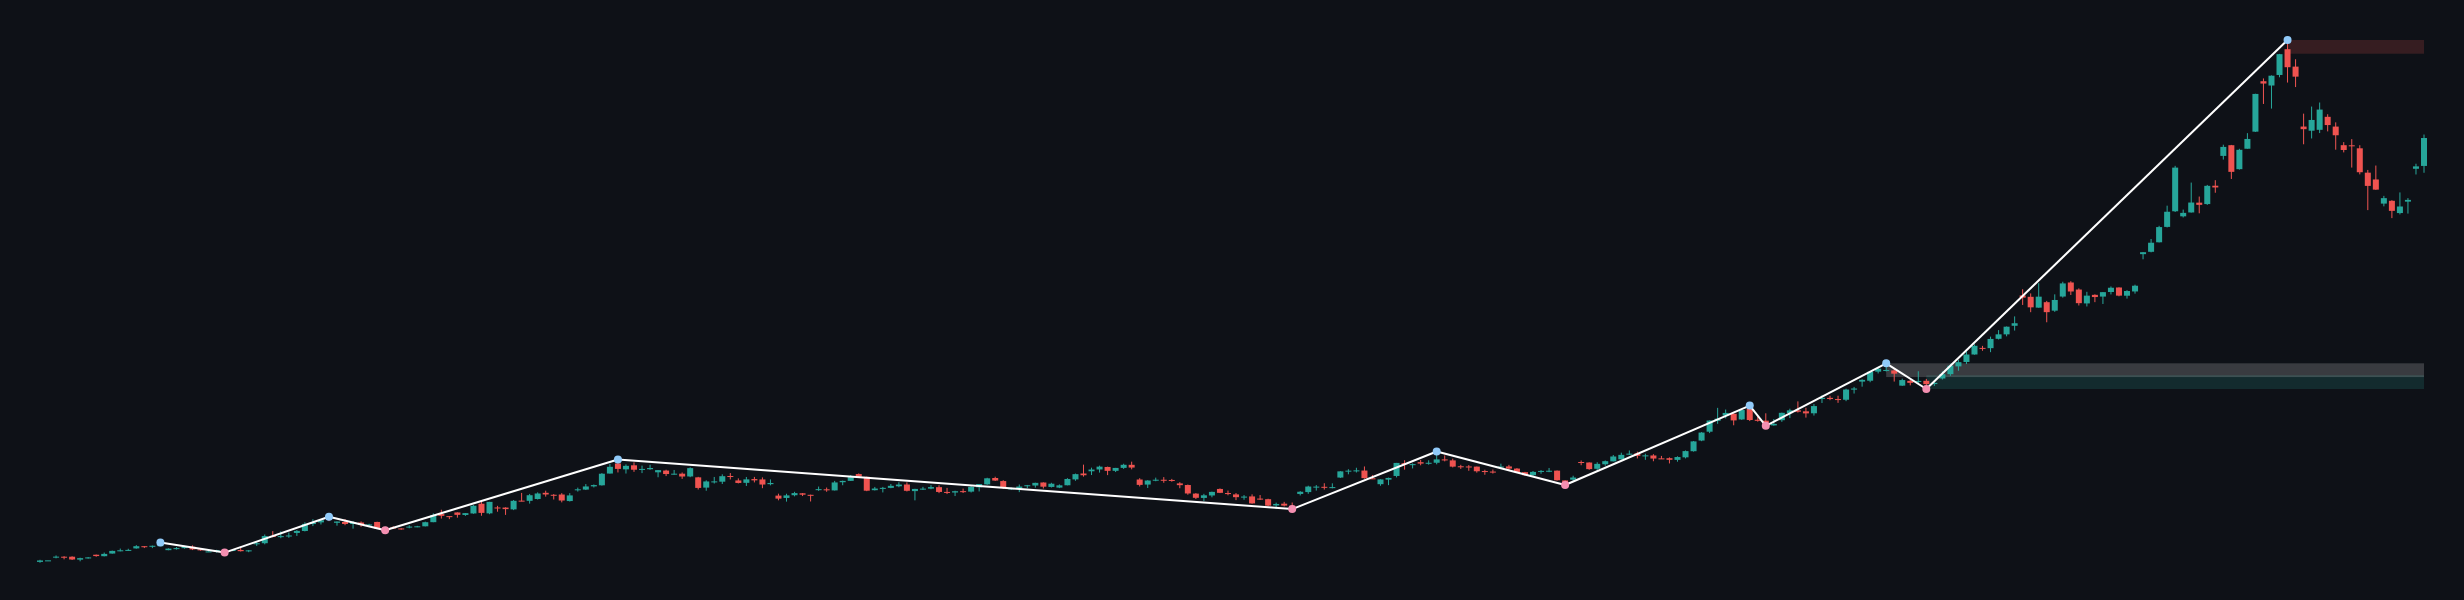
The weekly main trend is up and described as firm, although the sub-trend is down. No weekly structure event has been recorded, so the broader bullish framework remains intact rather than formally broken. The most recent confirmed weekly swing is a high at 5393.336.
Weekly price is positioned below the major resistance zone at 5283.109–5393.336. That area represents the most important higher-timeframe supply reference above the market. Below price, the weekly support zones are 2583.429–2693.656 and the broken-retest zone at 2679.872–2790.099.
The weekly moving-average values and their precise spacing are not determinable from the report. The available structure nevertheless permits a bullish continuation scenario while price remains supported above the relevant daily breakout area. A sustained failure back into lower support would weaken that interpretation.
Main-frame structure
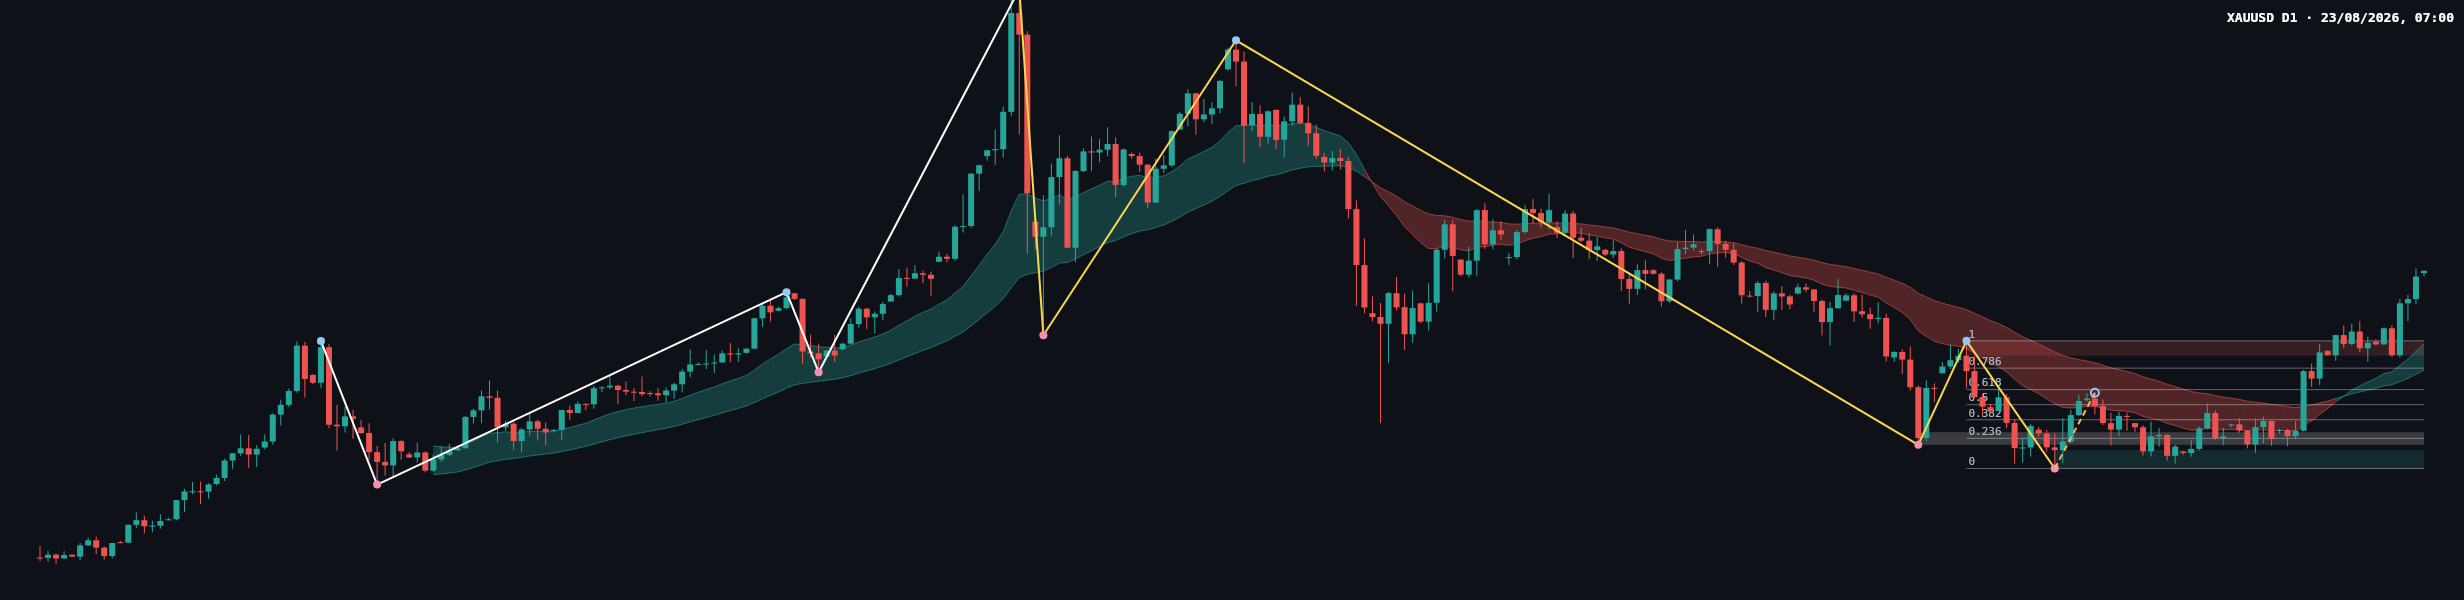
The daily main trend is down but shaky, while the sub-trend is up. This does not fully align with the weekly direction: the daily advance can be read as an early reversal signal or as a recovery within the broader daily decline. The decisive event is the change of character caused by the break of 4382.441.
The daily resistance zone is 4331.294–4382.441. Since price has closed above this area, it now becomes an important confirmation and retest reference. The broken-retest zone at 4023.812–4067.425 is a deeper structural level, while the main daily support zone is 3942.138–4005.629. The most recent confirmed daily swing is a low at 3942.138.
The daily moving-average values, exact slopes and spacing are not determinable from the report. Visually, the latest advance has lifted price back above the declining cloud-like average area, but a durable trend transition still requires acceptance above the broken resistance rather than a brief intraday excursion.
The latest completed Dow leg runs from 3942.138 to 4382.441. Its listed Fibonacci references are 4046.050, 4110.334, 4162.290, 4214.245 and 4288.216, with the current retracement ratio at 1.000. Price has therefore recovered to the full-leg reference, making the reaction around the former high especially important.
Key levels and recent price action
| Reference | Level or zone | Interpretation |
|---|---|---|
| Latest daily close | 4623.974 | Current daily reference |
| Weekly last closed price | 4604.083 | Higher-timeframe reference |
| Daily resistance | 4331.294–4382.441 | Former barrier and breakout-retest area |
| Daily broken-retest zone | 4023.812–4067.425 | Deeper support if the advance fails |
| Daily support | 3942.138–4005.629 | Primary downside structure zone |
| Weekly resistance | 5283.109–5393.336 | Major higher-timeframe supply |
The recent daily candles show a base-building phase followed by a sharp upward extension. The final sequence contains several bullish candles and closes near the upper part of the visible recovery, suggesting that buyers controlled the latest push. However, the move is now extended above the daily resistance zone, so rejection or consolidation would be a normal test of whether the breakout has been accepted.
The precise body and wick classification of the latest candle is not determinable from the report. Volume and momentum confirmation are also not available in the supplied data, so the breakout should be judged primarily by closing behavior and any subsequent retest of 4331.294–4382.441.
Conditional scenarios
Primary scenario: continuation above the breakout zone
If daily price holds above 4331.294–4382.441 and establishes acceptance above the former high at 4382.441, the bullish interpretation strengthens. The next major reference would be the weekly resistance zone at 5283.109–5393.336. This scenario is invalidated by a sustained return below 4331.294. On the available structure, this is the favored scenario while the breakout remains intact.
Secondary scenario: rejection and rotation toward daily support
If price fails to hold above 4331.294–4382.441 and closes back below 4331.294, the breakout may prove temporary. In that case, attention shifts toward the broken-retest zone at 4023.812–4067.425, followed by the support zone at 3942.138–4005.629. A recovery above 4382.441 would invalidate this bearish rotation scenario.
Risk scenario: deeper loss of daily support
If selling extends through 3942.138–4005.629, the daily change-of-character signal would lose much of its practical significance and the broader daily downtrend could reassert itself. The weekly support references at 2679.872–2790.099 and 2583.429–2693.656 would then become the next structural areas to monitor. A sustained reclaim of 4005.629 would weaken this deeper-bearish scenario.
Session considerations
- Resistance: monitor 4331.294–4382.441 as the nearest structural reference and 5283.109–5393.336 as the major weekly supply zone.
- Support: monitor 4023.812–4067.425 and 3942.138–4005.629 if the breakout loses follow-through.
- Confirmation: the bullish case is stronger if a daily close remains above 4382.441 and any retest holds above 4331.294.
- Traps: a brief move above resistance followed by a close back below the zone would represent a possible false breakout. Liquidity sweeps and volatility around the United States session can also distort early signals.
- Fundamentals: traders may monitor the dollar, United States yields, inflation and employment releases, central-bank communication, and geopolitical headlines. No specific event time is provided in the report.
- Risk principles: technical levels can fail without warning. General risk controls include avoiding excessive exposure, allowing for volatility, and being cautious ahead of major news.
The overall bias leans bullish while price holds above the daily breakout zone, but the market is approaching a decision point where rejection could reopen the path toward daily support.
Summary
- The weekly main trend remains firmly up, with major resistance at 5283.109–5393.336.
- The daily chart has produced a change of character after breaking 4382.441.
- The daily breakout zone at 4331.294–4382.441 is the key bullish confirmation and invalidation area.
- A failure below that zone would expose 4023.812–4067.425 and potentially 3942.138–4005.629.
The single most important thing today is whether price can sustain acceptance above 4382.441 rather than merely trade above it temporarily.
#XAUUSD #Gold #PriceAction #DowTheory #TechnicalAnalysis
Meta description: XAU/USD analysis: weekly strength meets a daily change of character, with 4382.441 defining the key breakout test.
This article is technical analysis and reference information only, not investment advice. Markets carry risk, and readers are responsible for their own decisions.