
XAU/USD is showing a higher-timeframe uptrend but a firm daily downtrend. The last closed price on the weekly context frame is 4043.851, while the daily frame shows a last closed price of 4278.091. The key near-term question is whether the daily recovery can challenge 4331.294–4382.441 resistance, or whether sellers regain control before that zone.
| Metric | Value |
|---|---|
| Weekly last closed price | 4043.851 |
| Daily last closed price | 4278.091 |
| Weekly trend | Up, firm; sub-trend down |
| Daily trend | Down, firm; sub-trend up |
| Nearest daily resistance | 4331.294–4382.441 |
| Nearest daily support | 3942.138–4005.629 |
| Active Fibonacci ratio | 0.763 |
Higher-timeframe context
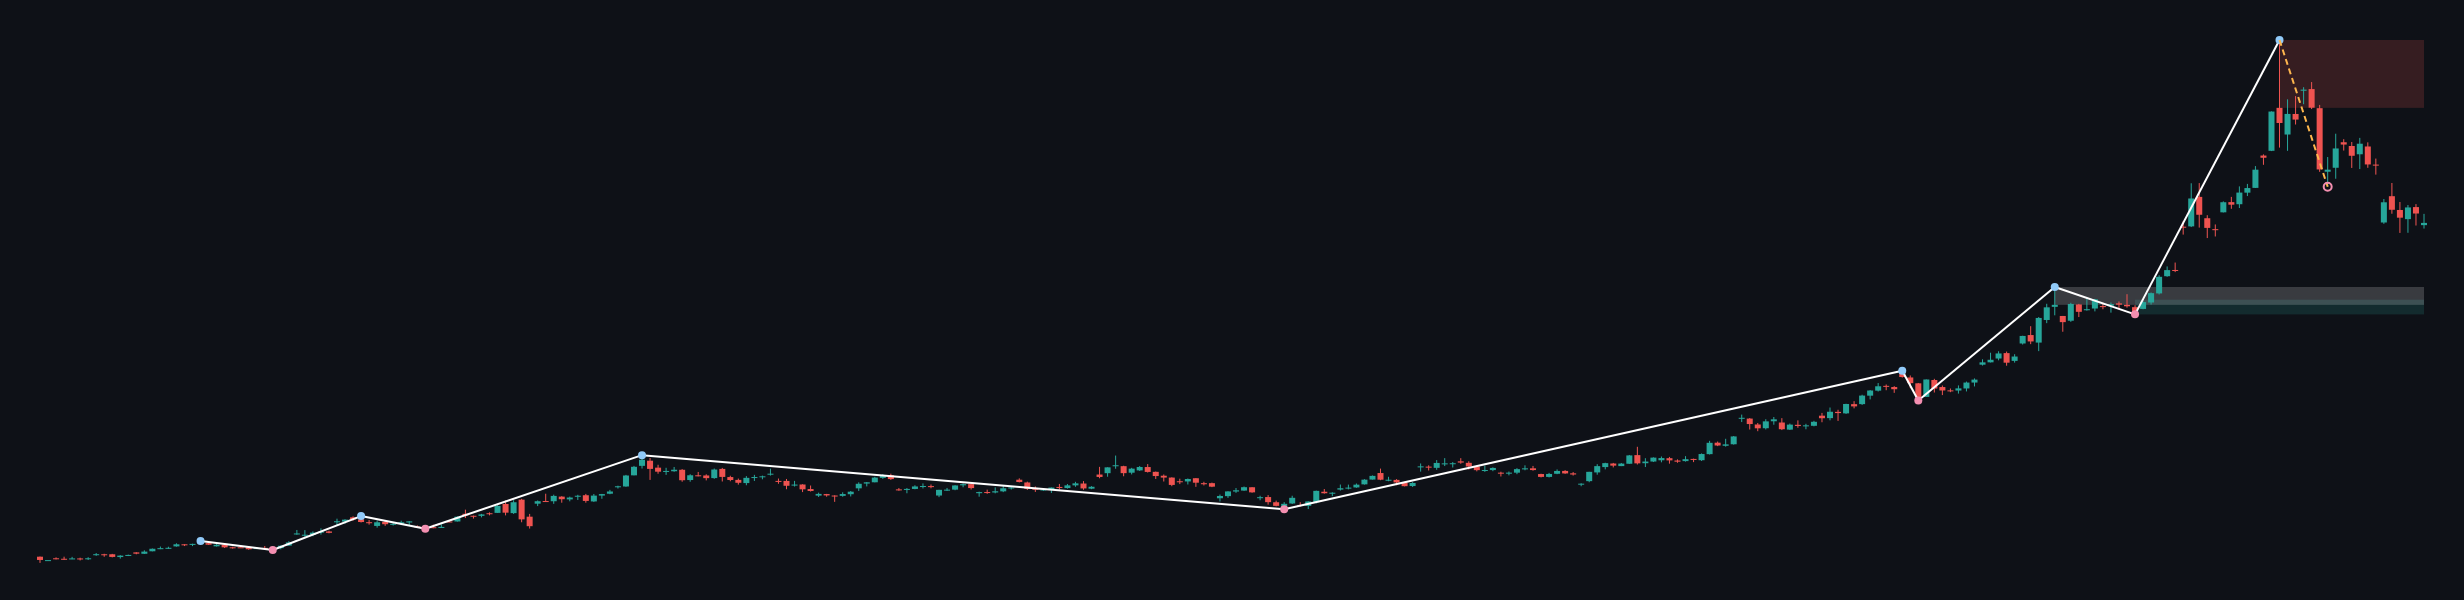
The weekly structure remains an uptrend, described in the report as firm, although its sub-trend is down. The most recent confirmed weekly swing is a high at 5595.362, and no weekly structure event is recorded. This combination permits a corrective phase without confirming a broader reversal.
The weekly chart has a major support zone at 3268.058–3392.201 and a broken-retest support zone at 3349.000–3500.057. Above the market, the weekly resistance zone is 5019.871–5595.362. The weekly ATR is 248.286, indicating that the broader frame allows materially wider movement than the daily frame.
The weekly report does not provide numerical values for the moving averages, so their exact levels, spacing and crossover status are not determinable from the deterministic data. The broad reading is therefore based on the reported trend and zones rather than unreported moving-average values.
For the larger picture, the weekly framework still favors treating weakness as a correction within an established uptrend unless a meaningful structure event appears. However, the down sub-trend means upside continuation is not automatic.
Main-frame structure
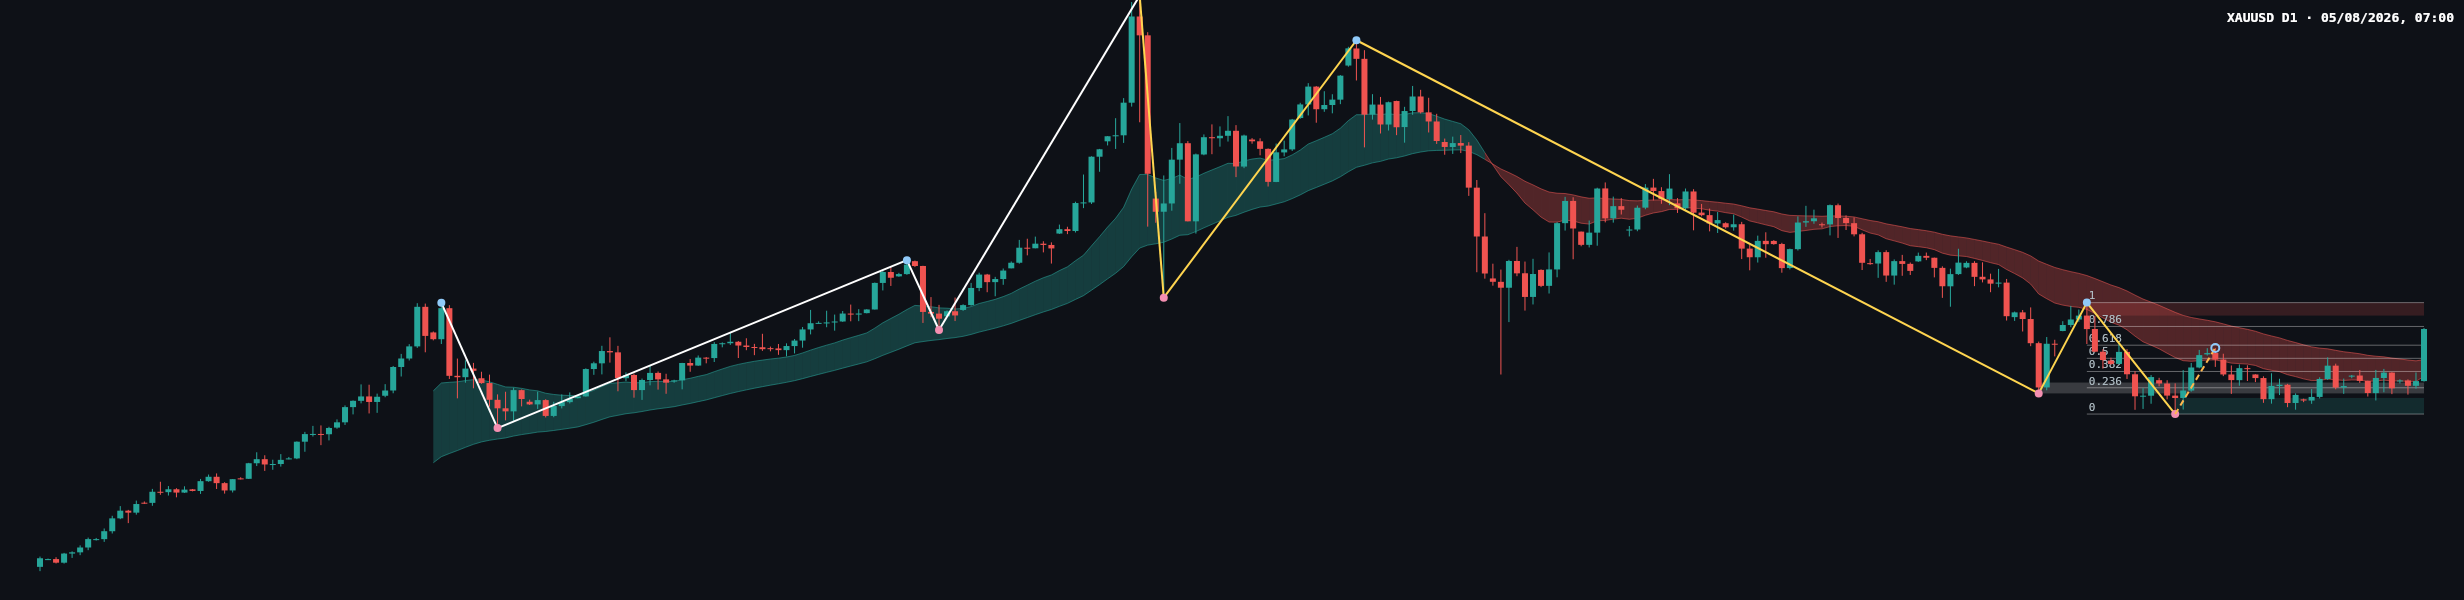
The daily trend is down and firm, while the sub-trend is up. This conflicts with the weekly directional framework and is best treated as a daily recovery inside a larger corrective phase unless price can establish acceptance above the daily resistance zone at 4331.294–4382.441.
The latest completed daily Dow leg runs from 3942.138 to 4382.441. Its Fibonacci levels are 0 at 3942.138, 0.236 at 4046.050, 0.382 at 4110.334, 0.5 at 4162.290, 0.618 at 4214.245, 0.786 at 4288.216, and 1 at 4382.441. The current retracement ratio is 0.763, placing the market close to the 0.786 retracement level at 4288.216.
The daily support structure is concentrated at 3942.138–4005.629. The broken-retest resistance zone is 4023.812–4066.530. Since the latest daily close is above that broken-retest zone and near the upper Fibonacci retracement area, the recovery has moved beyond an earlier barrier, but it has not yet cleared the main supply zone.
The daily ATR is 85.436. This provides the relevant volatility context for the main frame, but it should not be converted into a forecast or an order level.
Key levels and the latest price action
The primary upside reference is 4331.294–4382.441. The upper boundary also matches the 1 Fibonacci level at 4382.441, making this a technically important area. A sustained daily close above that zone would weaken the immediate bearish interpretation, with the weekly resistance zone at 5019.871–5595.362 becoming the next major overhead reference.
The first downside references are the Fibonacci levels at 4288.216, 4214.245 and 4162.290. Deeper support is located at 3942.138–4005.629. The broken-retest zone at 4023.812–4066.530 remains relevant as a historical barrier and possible test area, but the report does not establish a new daily structure event.
The chart shows a recent rebound from the daily swing low at 3942.138 followed by consolidation beneath the upper resistance area. Exact candle classifications, wick proportions and moving-average values are not provided in the deterministic report, so a precise candle-by-candle description is not determinable from the permitted data. The reliable conclusion is that buyers have lifted price toward the 0.786 retracement, while sellers still have a clearly defined resistance zone above.
Conditional scenarios
Bullish scenario
If price secures acceptance above 4331.294–4382.441, the daily downtrend would face a significant challenge. The next higher-timeframe reference would be the weekly resistance zone at 5019.871–5595.362. This scenario is invalidated if price rejects the daily resistance zone and returns below the nearby Fibonacci reference at 4288.216 without reclaiming the resistance area.
Bearish scenario
If the recovery fails around 4288.216 or within 4331.294–4382.441, sellers may steer the market back toward the Fibonacci levels at 4214.245 and 4162.290. A deeper bearish continuation would refocus attention on 3942.138–4005.629. This scenario is invalidated by sustained acceptance above 4382.441.
Range scenario
If neither side achieves acceptance beyond the nearby Fibonacci and resistance references, consolidation may continue between the recovery area around 4288.216 and the resistance zone at 4331.294–4382.441. This scenario is invalidated by a decisive move beyond that upper zone or by a renewed decline through the lower Fibonacci references toward 3942.138–4005.629.
What to monitor
- Resistance: 4331.294–4382.441, followed by weekly resistance at 5019.871–5595.362.
- Fibonacci references: 4288.216, 4214.245, 4162.290, 4110.334 and 4046.050.
- Support: 3942.138–4005.629, with the broken-retest zone at 4023.812–4066.530 as an additional structural reference.
- Confirmation would come from acceptance beyond a zone rather than a brief intraday probe. A failed breakout, liquidity sweep or sharp reversal around the daily resistance area would support the bearish or range interpretation.
- The weekly support areas at 3268.058–3392.201 and 3349.000–3500.057 are distant context zones rather than immediate daily decision areas.
Macro-sensitive drivers such as the US dollar, Treasury yields, scheduled inflation and employment data, central-bank communication and geopolitical headlines can change the behavior around these technical levels. The report supplies no confirmed event schedule or exact time window. General risk controls remain important, including avoiding assumptions during event-driven volatility, keeping exposure proportionate to account risk and reassessing invalidation when the market structure changes.
Summary
- The weekly trend is up and firm, but the weekly sub-trend is down.
- The daily trend is down and firm, while the daily sub-trend is up.
- The current retracement ratio is 0.763, close to the 0.786 Fibonacci level at 4288.216.
- The main decision zone is daily resistance at 4331.294–4382.441.
- Failure above resistance keeps the downside references at 4214.245, 4162.290 and 3942.138–4005.629 relevant.
The single most important thing today is whether price can achieve sustained acceptance above 4331.294–4382.441 or instead confirms rejection near the upper retracement area.
#XAUUSD #Gold #PriceAction #DowTheory #TechnicalAnalysis
Meta description: XAU/USD analysis: weekly strength meets daily weakness as gold tests 4331.294–4382.441 resistance and the 0.786 retracement.
This article is technical analysis and reference information only, not investment advice. Markets carry risk, and readers are responsible for their own decisions.