
GBPUSD closed at 1.32095, just above the daily support zone at 1.31804 – 1.32086. The broader weekly and daily trends are both down, while their upward sub-trends point to a possible recovery; price action around support will help distinguish a pullback from renewed downside pressure.
Higher-timeframe context
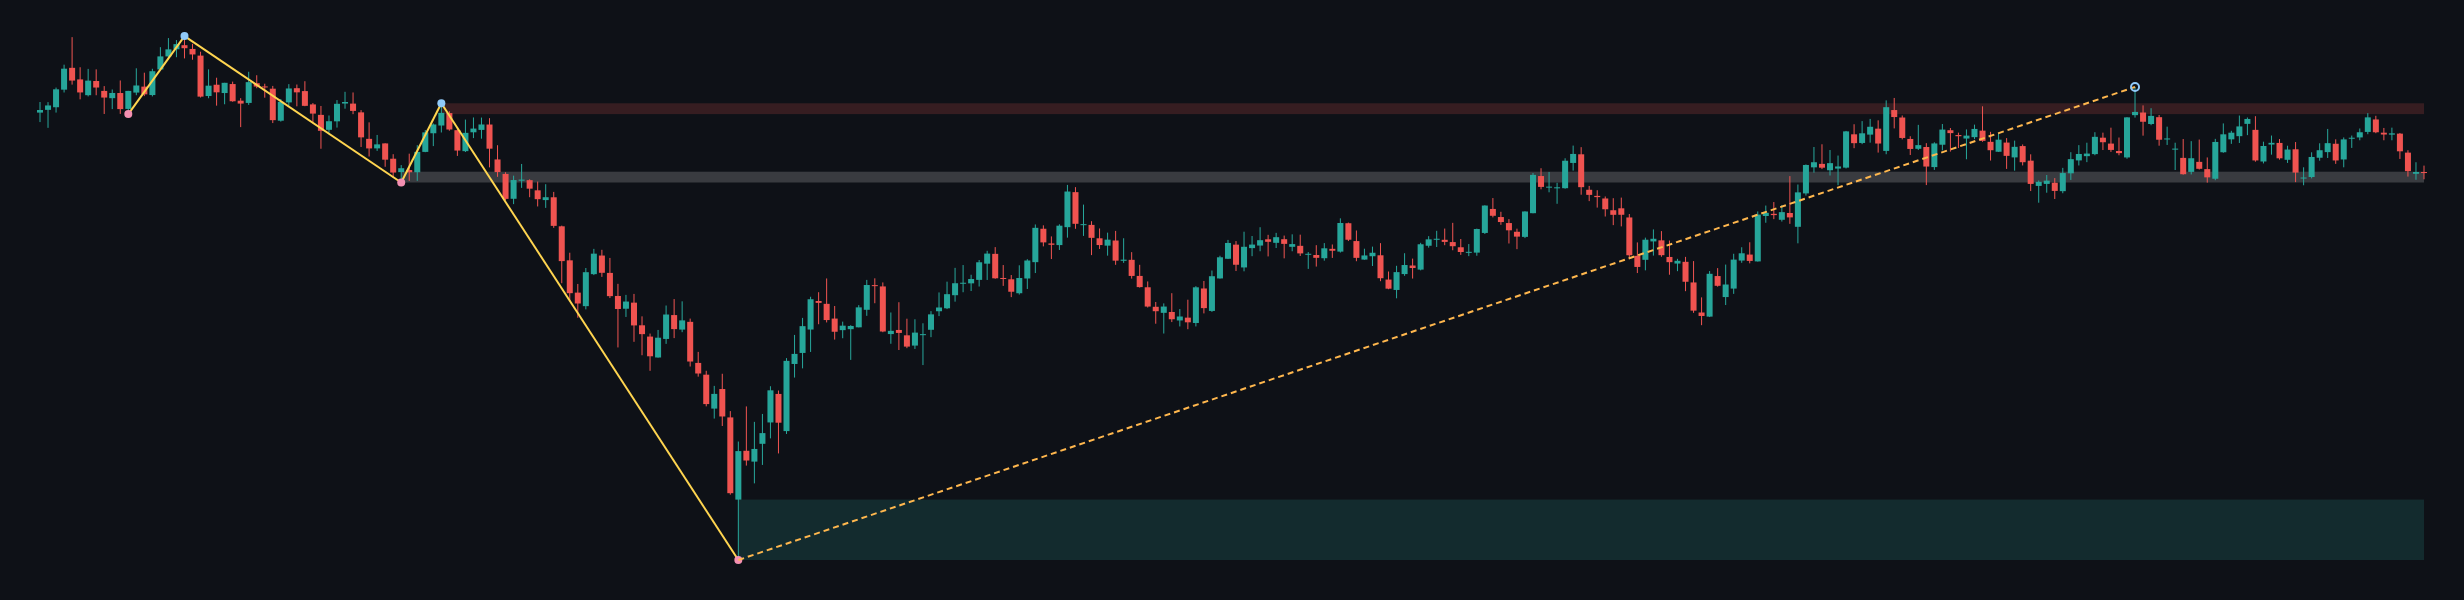
The weekly trend is down, with an upward sub-trend and no reported structure event. The last close remains within the weekly broken-retest resistance zone at 1.31602 – 1.32401, so this area is an important test rather than clear support or resistance. Higher weekly resistance is at 1.36688 – 1.37487, while the reported weekly support zone is 1.03535 – 1.08025.
The weekly chart therefore permits a recovery, but does not yet establish a trend reversal. A sustained move above 1.32401 would improve the recovery case; failure to hold above 1.31602 would weaken it. The most recent confirmed weekly swing is the low at 1.03535.
Main-frame structure
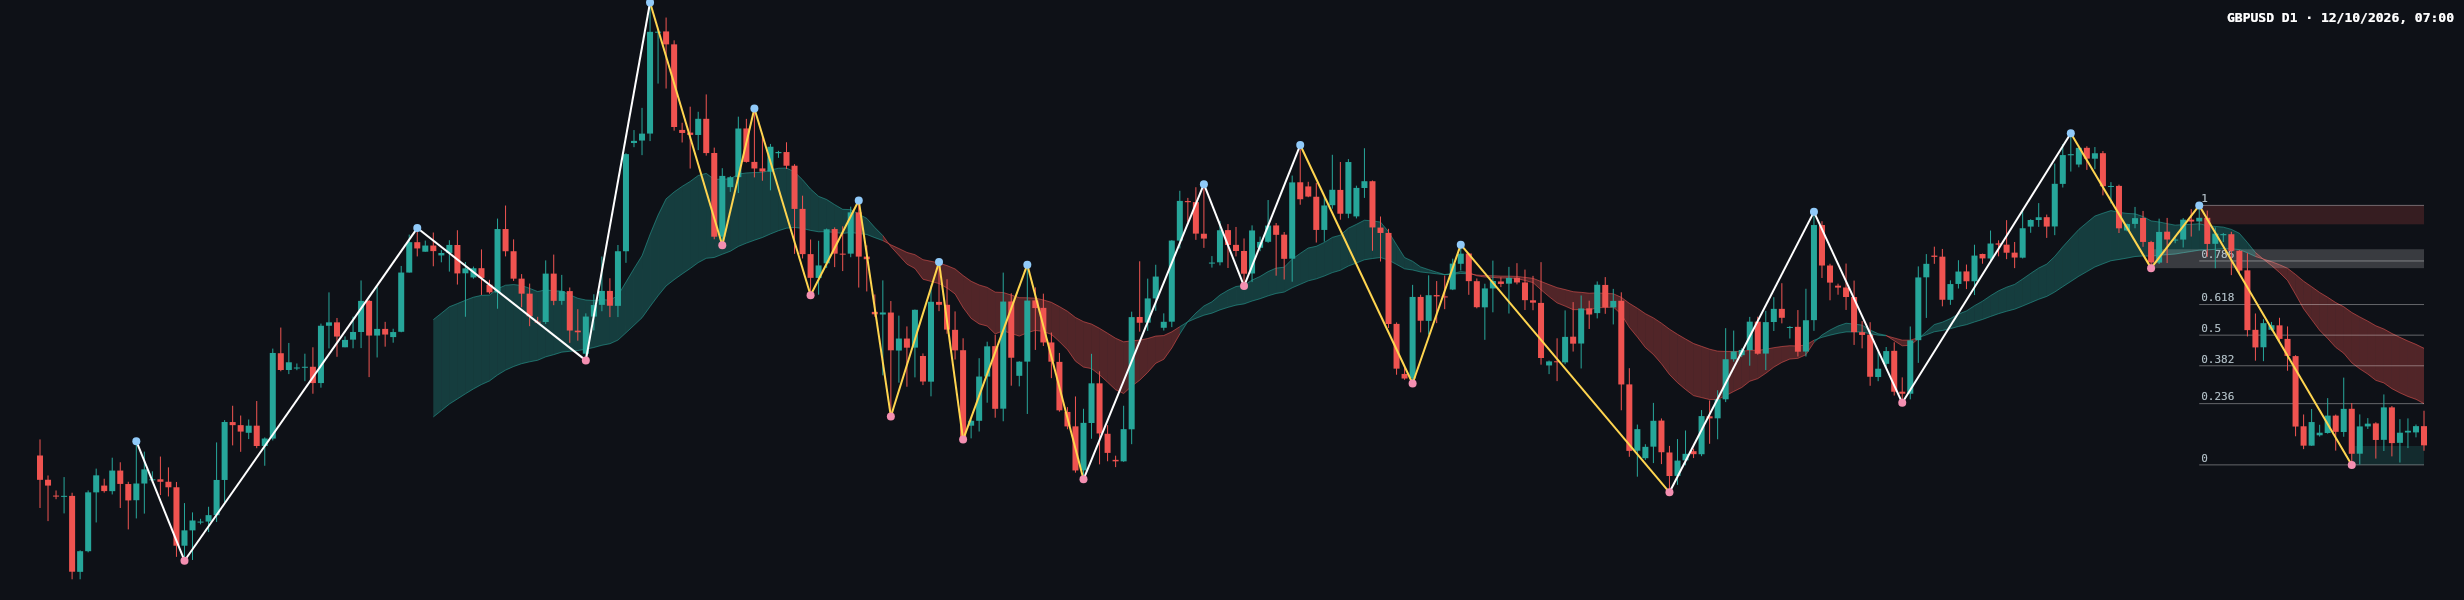
On the daily frame, the main trend is also down and the sub-trend is up, with no reported structure event. The latest confirmed swing low is 1.31804. The last close at 1.32095 is only just above the daily support zone at 1.31804 – 1.32086, leaving little separation from the area that would need to hold for the recovery attempt to remain intact.
The chart shows a sharp decline followed by a compact cluster of candles near the recent low. That visual pattern suggests selling pressure has eased from its steepest phase, but does not confirm a reversal. The chart’s moving-average overlays are visible, but their numerical values and exact relationship to the close are not provided in the report, so no precise moving-average conclusion is warranted.
The latest completed Dow leg has Fibonacci levels at 1.31804, 1.32718, 1.33283, 1.33740, 1.34197, 1.34847, and 1.35676. The current retracement ratio is 0.075, indicating that the rebound remains shallow relative to that leg. A move toward the higher retracement levels would be evidence of improving recovery momentum, but would not by itself overturn the reported downtrend.
Key levels
- Daily support: 1.31804 – 1.32086. The last close is just above this zone; a break and failure to recover it would put the recent swing low under pressure.
- Weekly broken-retest zone: 1.31602 – 1.32401. This overlaps the current market area and is a key test for whether price can establish a firmer base.
- First Fibonacci reference above the close: 1.32718, followed by 1.33283 and 1.33740. These are reference levels, not order instructions.
- Daily broken-retest resistance: 1.34740 – 1.35022.
- Higher daily resistance: 1.35394 – 1.35676.
- Higher weekly resistance: 1.36688 – 1.37487.
Scenarios
Bullish recovery: If price holds the daily support zone and advances through 1.32718, attention could turn to 1.33283 and then 1.33740. A return below 1.31804 would undermine this recovery scenario. This would remain a counter-move while the reported main trend is down.
Bearish continuation: If price breaks below 1.31804 and cannot reclaim the 1.31804 – 1.32086 zone, the recent low would be vulnerable to further downside. A recovery above 1.32718 would weaken this scenario. The report does not provide a nearer downside target below the daily support zone, so no additional target is specified.
Range and retest: If price continues to hold around the daily support while remaining below 1.32718, consolidation may persist. A break below 1.31804 would invalidate the holding pattern; a move above 1.32718 would instead shift attention toward the next Fibonacci references.
The immediate bias is cautious and slightly bearish while price remains below 1.32718, but the support zone has not been decisively lost. The key evidence is whether price can hold 1.31804 – 1.32086 or reclaim higher reference levels.
Technical analysis is for information only and is not investment advice. Markets involve risk, and scenarios are conditional rather than guaranteed.