
GBPUSD closed at 1.32378, below the daily structure level at 1.32730 after a sharp decline from the latest confirmed swing high. The daily trend is up but shaky, with a down sub-trend; on the weekly chart, the main trend remains down while the sub-trend is up. Price is now within the weekly 1.31602–1.32423 broken-retest zone, making its response there a key point of attention.
Higher-timeframe context
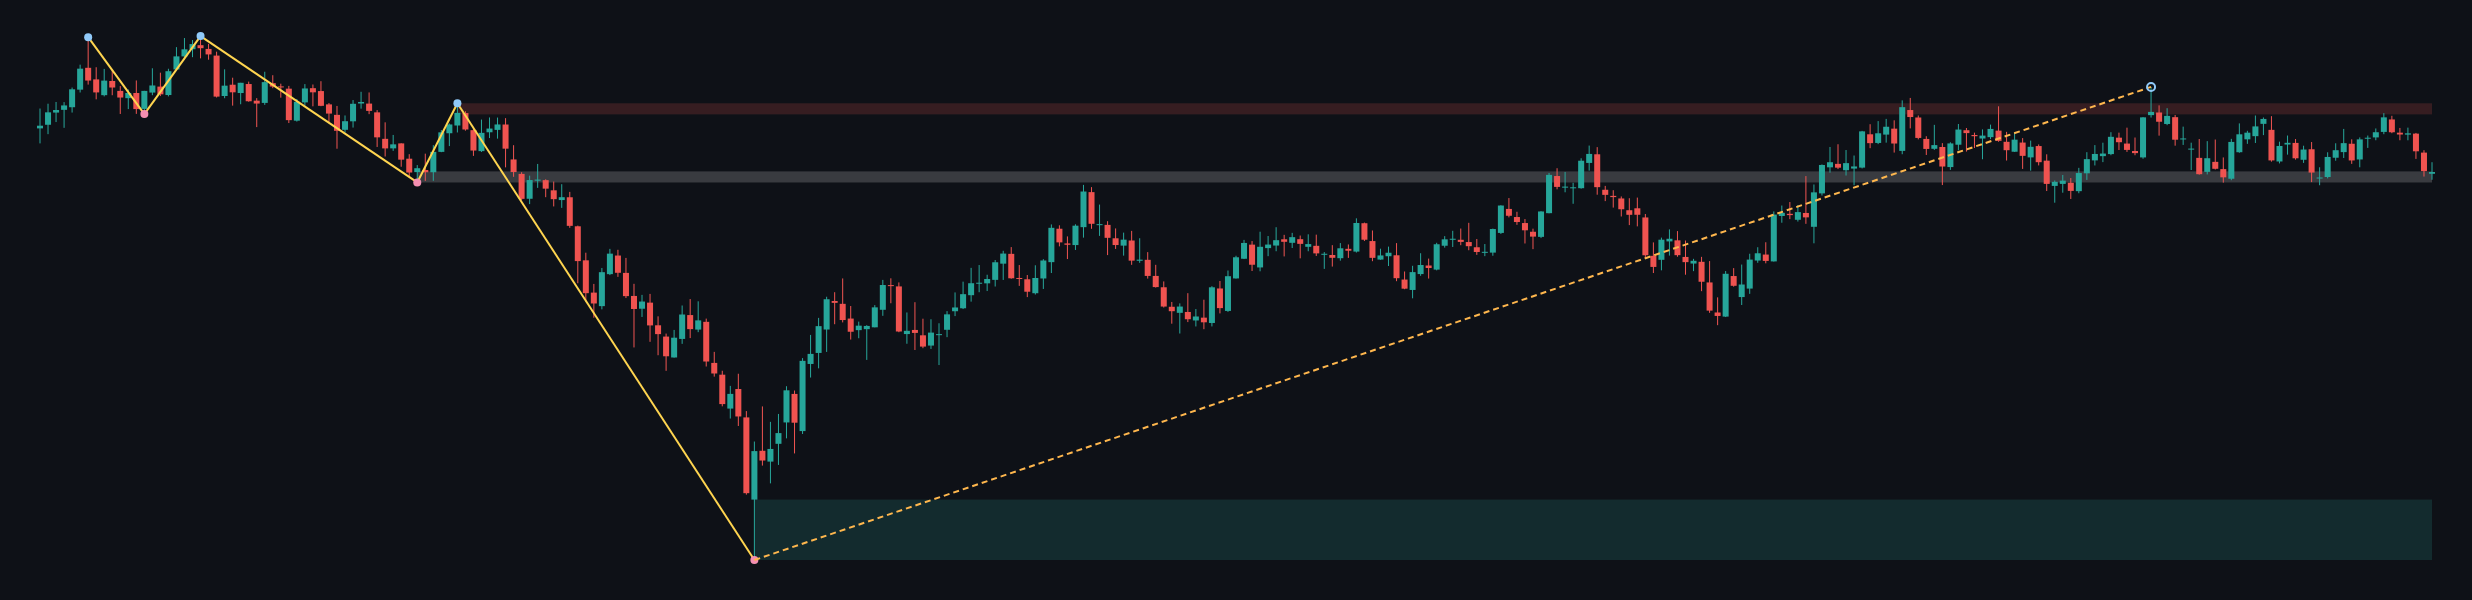
The weekly main trend is down, although the sub-trend is up. The report identifies no weekly structure event, and the most recent confirmed swing is the low at 1.03535. This combination shows a recovery within a broader downtrend, rather than a confirmed change in the weekly direction.
The close is inside the weekly 1.31602–1.32423 broken-retest zone. A sustained hold in this area could help the weekly recovery persist; a decisive move below it would weaken that case. The next marked weekly support zone is 1.03535–1.08025, while weekly resistance zones are 1.36666–1.37487 and, on the daily chart, 1.36441–1.36754. The weekly report provides no Fibonacci reading, so a weekly Fibonacci interaction is not determinable from the supplied data.
Main-frame structure
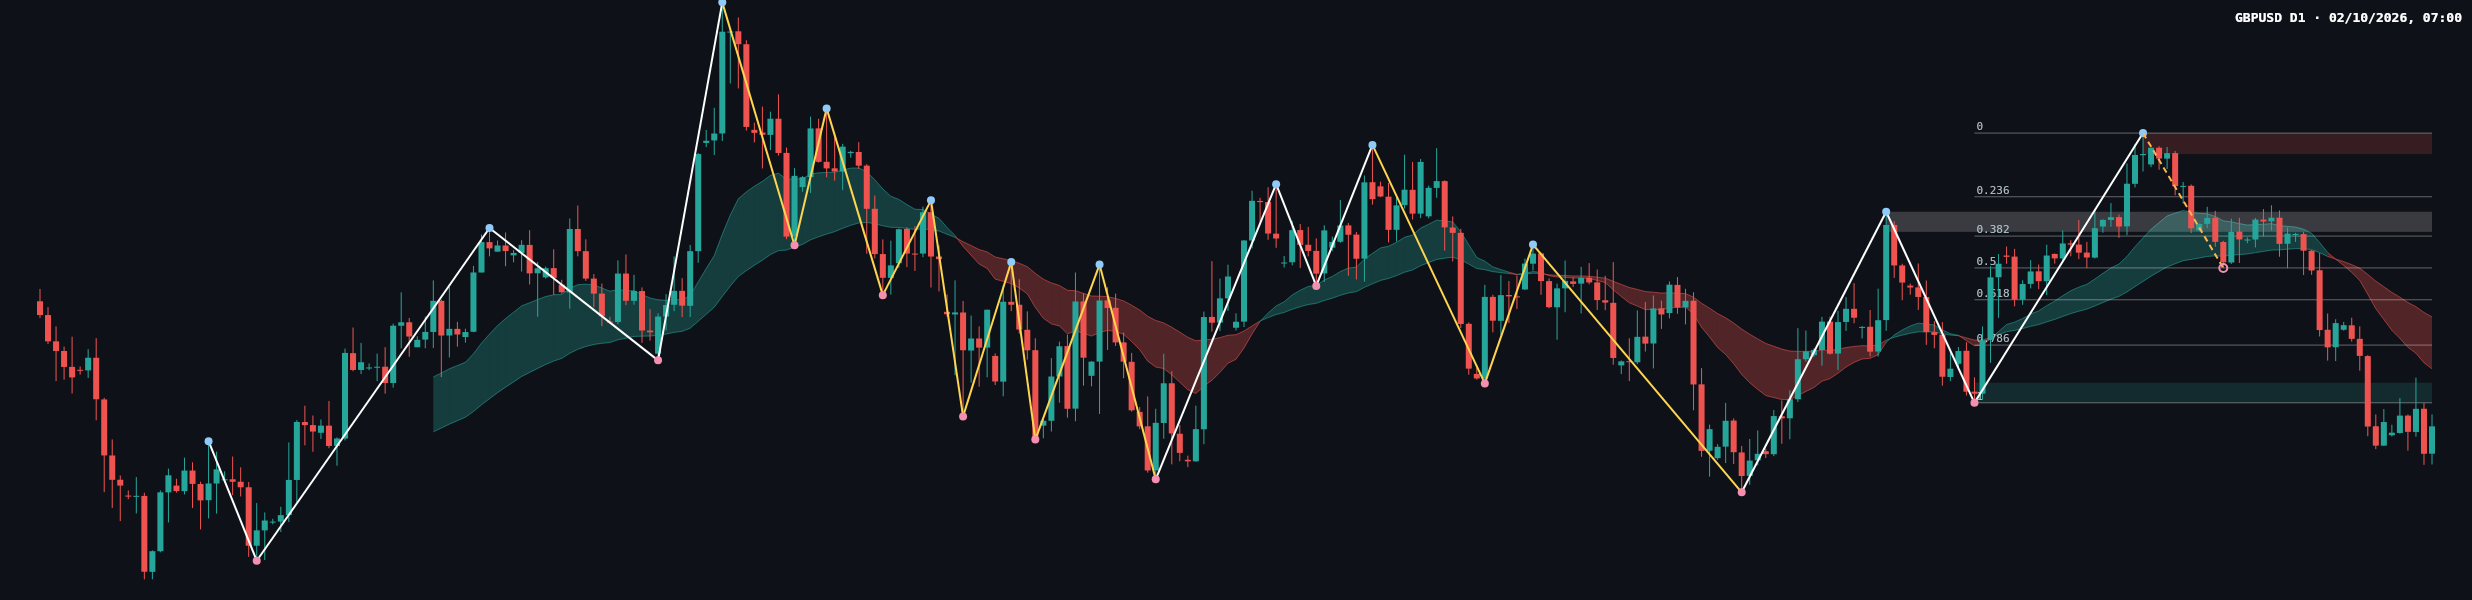
On the daily frame, the main trend is up but shaky, while the sub-trend is down. The reported change of character is tied to the broken level at 1.32730. With the close at 1.32378, price is below that level and below the daily support zone at 1.32730–1.33029; this weakens the near-term bullish structure unless price can reclaim the zone.
The latest completed Dow leg has fully retraced: the current ratio is 1.000, corresponding to 1.32730. Other listed Fibonacci references are 1.33591 at 0.786, 1.34267 at 0.618, 1.34742 at 0.5, 1.35217 at 0.382, and 1.35804 at 0.236. The close is below the completed leg’s 1.32730 endpoint, so recovery through that level would be needed to challenge the current bearish pressure.
The chart shows a sharp downswing from the most recent swing high at 1.36754, followed by small, uneven candles at the right edge. The latest price action does not yet establish a clear recovery; it remains below the broken daily level. EMA values, volume readings, and a precise candle classification are not provided in the deterministic data, so those details are not determinable here.
Key levels
- Weekly zone under test: 1.31602–1.32423. Price is inside this broken-retest area.
- Daily structure and support zone: 1.32730–1.33029. The close is below it; a reclaim would improve the recovery case.
- Next marked Fibonacci reference: 1.33591; higher listed references include 1.34267, 1.34742, 1.35217, and 1.35804.
- Daily resistance and swing-high area: 1.36441–1.36754. The most recent confirmed daily swing high is 1.36754.
- Farther weekly support: 1.03535–1.08025. This is a distant marked zone, not a near-term projection.
Scenarios
Bullish recovery: If price reclaims and holds above 1.32730–1.33029, the immediate breakdown would be less convincing. The next listed Fibonacci reference is 1.33591, with 1.34267 another level to monitor if recovery continues. A move back below 1.31602 would undermine this recovery scenario.
Bearish continuation: If price remains below 1.32730 and breaks beneath the weekly zone at 1.31602–1.32423, the downside structure would remain in control. The next marked support on the supplied charts is the distant weekly zone at 1.03535–1.08025; the report does not provide an intervening support target. A reclaim of 1.33029 would weaken this scenario.
Consolidation: If price continues to trade between 1.31602 and 1.33029, the weekly zone and broken daily support area may contain price without resolving direction. A sustained move beyond either boundary would challenge this range scenario. The supplied data do not support reliable probability estimates.
The near-term bias leans cautious to bearish while price remains below 1.32730–1.33029, but the weekly zone at 1.31602–1.32423 leaves room for a recovery if buyers defend it and reclaim the daily area.
This analysis is technical reference material, not investment advice. Markets carry risk, and readers are responsible for their own decisions.