
GBPUSD closed at 1.33919. The higher-timeframe picture remains conflicted: the weekly trend is down, while the daily trend is up but currently undergoing a bearish sub-trend. The most important feature is the current retracement from the confirmed daily swing high at 1.36754 toward the support area at 1.32730–1.33003.
Higher-timeframe context
The weekly chart identifies a firm main trend to the downside, while the sub-trend is upward. No weekly structure event has been recorded, so the recovery from the confirmed swing low at 1.03535 has not yet changed the broader directional classification.
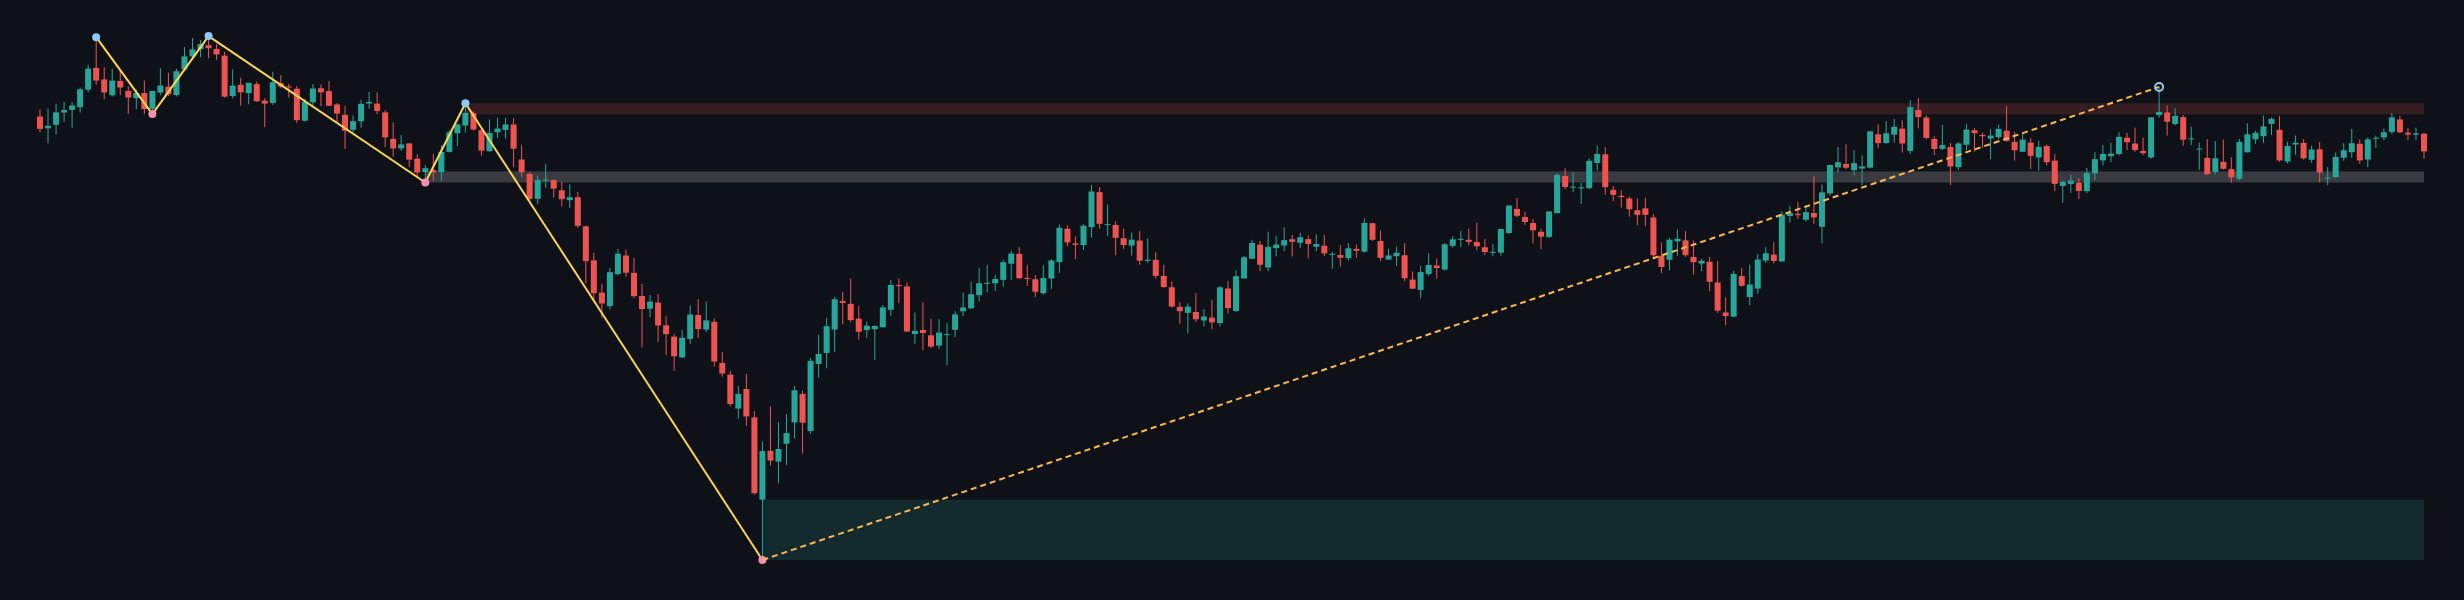
Weekly resistance is located at 1.36664–1.37487. A lower weekly resistance area sits at 1.31602–1.32425 and is marked as a broken-retest zone. The wider weekly support zone is 1.03535–1.08025. With the close at 1.33919, price is positioned between these larger zones rather than directly at the weekly resistance band.
The weekly chart does not provide numerical moving-average values in the report, so their exact position and spacing are not determinable here. The higher timeframe permits continued consolidation or a corrective advance, but the firm weekly downtrend means that resistance reactions remain important.
Main-frame structure
The daily main trend is firmly up, but the sub-trend is down. This is a misalignment with the weekly trend: the daily decline can be read as a pullback within the daily advance, while a sustained move through daily support would increase the possibility that the larger recovery is weakening.
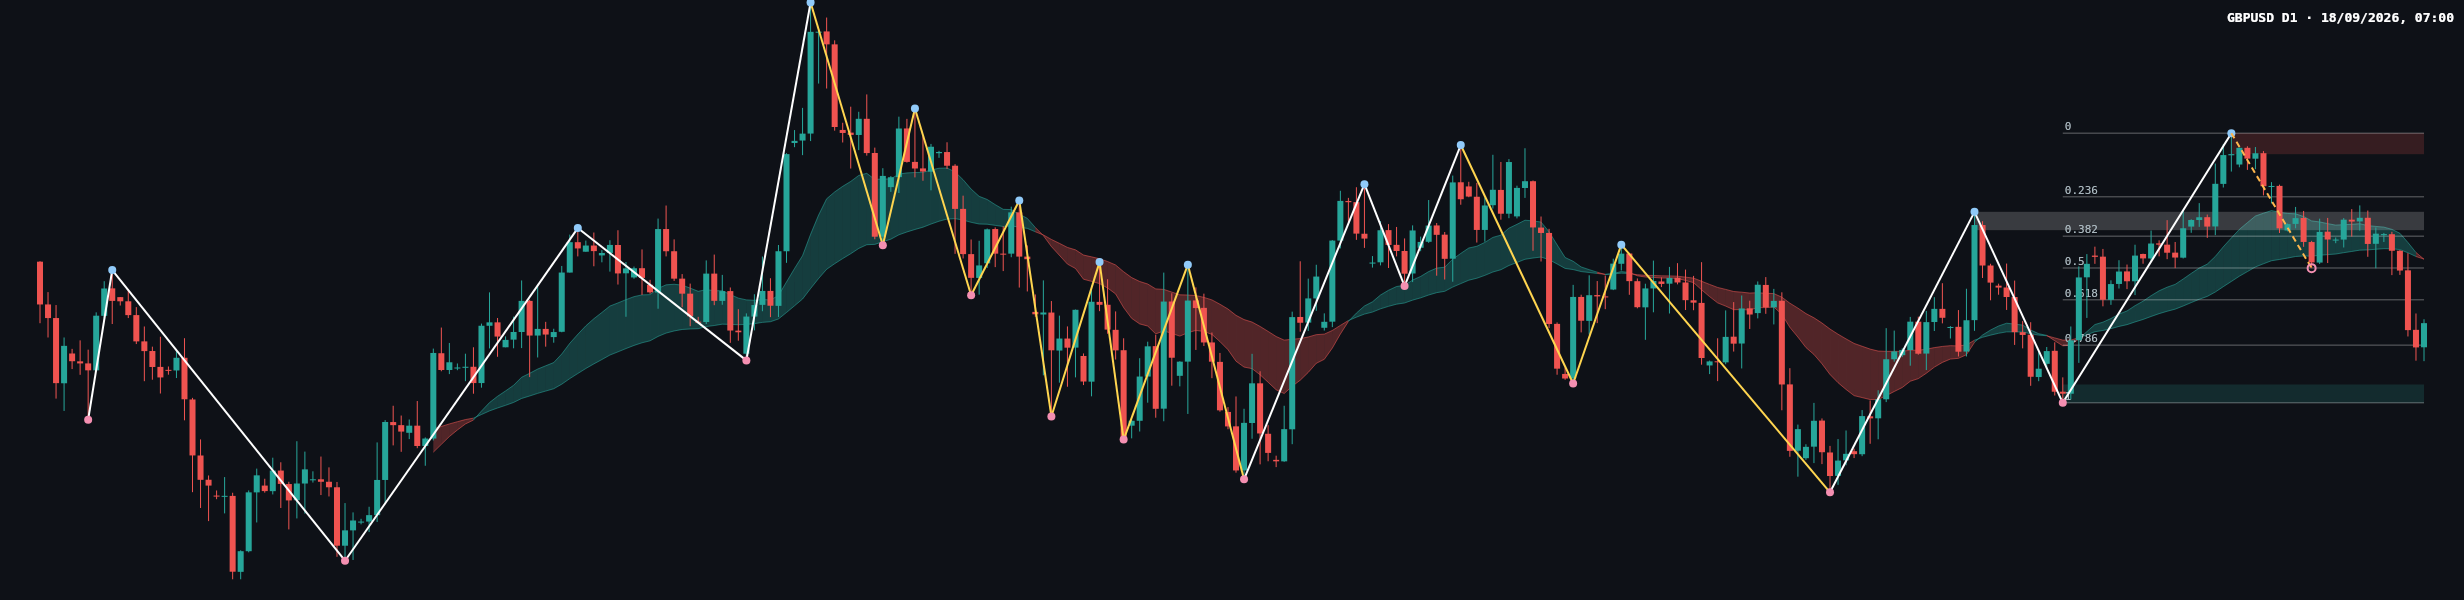
The latest confirmed daily swing high is 1.36754. No daily structure event has been recorded. The daily support zone at 1.32730–1.33003 is therefore the principal structural area below the close. The broken-retest support zone at 1.35307–1.35580 is above current price and may act as an important test if the market rebounds.
The daily Fibonacci leg runs from 0: 1.36754 to 1: 1.32730. Its listed levels are 0.236: 1.35804, 0.382: 1.35217, 0.5: 1.34742, 0.618: 1.34267, and 0.786: 1.33591. The current retracement ratio is 0.705, placing the market between 0.618: 1.34267 and 0.786: 1.33591. This area is consistent with a market that is still correcting rather than one that has already confirmed a new daily bearish structure.
The report does not provide numerical moving-average readings, so exact moving-average levels, spacing, and crossovers are not determinable. The chart nevertheless shows the daily moving-average area as part of the current pullback structure.
Key levels and recent price action
| Area | Level | Role in the structure |
|---|---|---|
| Current close | 1.33919 | Reference point for the present retracement |
| Daily support | 1.32730–1.33003 | Primary structural support zone |
| Daily broken-retest zone | 1.35307–1.35580 | Potential recovery test above current price |
| Daily resistance | 1.36441–1.36754 | Resistance surrounding the confirmed swing high |
| Weekly resistance | 1.36664–1.37487 | Higher-timeframe supply area |
| Fibonacci support reference | 0.786: 1.33591 | Lower retracement reference before daily support |
The most recent candles show selling pressure after rejection from the higher daily area, followed by a smaller recovery attempt near the latest close. The exact candle classifications and range comparisons are not provided numerically in the report, so a precise candle-by-candle comparison is not determinable. The visible sequence is consistent with sellers controlling the recent downswing, while buyers are attempting to stabilize above the lower Fibonacci reference and the daily support zone.
There is no volume or momentum dataset in the report. Any confirmation from those tools is therefore not determinable from the supplied data.
Scenarios
Bullish scenario
- Trigger condition: Price stabilizes above 1.33591 and reclaims the broken-retest zone at 1.35307–1.35580.
- Potential objective area: The next major resistance region is 1.36441–1.36754, followed by the weekly resistance zone at 1.36664–1.37487.
- Invalidation: A sustained move below the daily support zone at 1.32730–1.33003 would weaken this recovery scenario.
- Estimated probability: Not determinable from the report.
Bearish scenario
- Trigger condition: Price breaks and holds below 1.33591, followed by pressure into the daily support zone at 1.32730–1.33003.
- Potential objective area: The first structural area to monitor is 1.32730–1.33003; a broader continuation would bring the weekly broken-retest area at 1.31602–1.32425 into focus.
- Invalidation: Recovery through 1.35307–1.35580 would challenge the immediate bearish interpretation.
- Estimated probability: Not determinable from the report.
Range and rejection scenario
- Trigger condition: Price remains between the Fibonacci references at 1.33591 and 1.34267 without a confirmed daily structure event.
- Potential objective area: The market may continue rotating between the lower Fibonacci area and the broken-retest zone at 1.35307–1.35580.
- Invalidation: A decisive move below 1.32730–1.33003 or above 1.36441–1.36754 would reduce the range interpretation.
- Estimated probability: Not determinable from the report.
What to monitor
- Whether 1.33591 holds as the nearest Fibonacci reference.
- Whether the daily support zone at 1.32730–1.33003 produces stabilization or a confirmed breakdown.
- Whether a rebound can reclaim 1.35307–1.35580.
- Whether resistance at 1.36441–1.36754 aligns with the weekly supply zone at 1.36664–1.37487.
- Whether a new structure event develops, since none is currently recorded on either timeframe.
The central confirmation issue is whether price accepts below 1.33591 or recovers above 1.35307–1.35580. False breaks and rapid reversals around these areas remain possible, particularly while the weekly and daily trend classifications disagree. The supplied report contains no economic-calendar or news information, so fundamental event risk is not determinable from the available data.
Conclusion
GBPUSD is balancing a firm weekly downtrend against a firm daily uptrend. The current retracement ratio of 0.705 places price between 1.34267 and 1.33591, making those Fibonacci references and the daily support zone at 1.32730–1.33003 central to the next directional decision. A recovery through 1.35307–1.35580 would improve the bullish daily case, while acceptance below 1.32730–1.33003 would favor broader downside continuation.
#GBPUSD #ForexAnalysis #PriceAction #DowTheory #TechnicalAnalysis
Meta description: GBPUSD analysis covering weekly and daily trends, Fibonacci retracement, support at 1.32730–1.33003, resistance, and conditional scenarios.
This article is technical analysis and reference information only, not investment advice. Markets carry risk, and readers are responsible for their own decisions.