
GBPUSD is consolidating near the upper boundary of its daily range. The last closed price is 1.35499, placing the market inside the daily resistance zone at 1.35308–1.35580. The broader weekly trend remains firmly down, although the weekly sub-trend is up, leaving price at an important point of tension between recovery and renewed selling.
| Metric | Reading |
|---|---|
| Last closed price | 1.35499 |
| Weekly trend | Down; sub-trend up |
| Daily trend | Sideways |
| Nearest resistance | 1.35308–1.35580 |
| Nearest support | 1.34818–1.35090 |
| Active Fibonacci reading | Current retracement ratio 0.019; latest completed leg anchored at 1.35580 and 1.31395 |
| Daily ATR | 0.00545 |
Higher-timeframe context
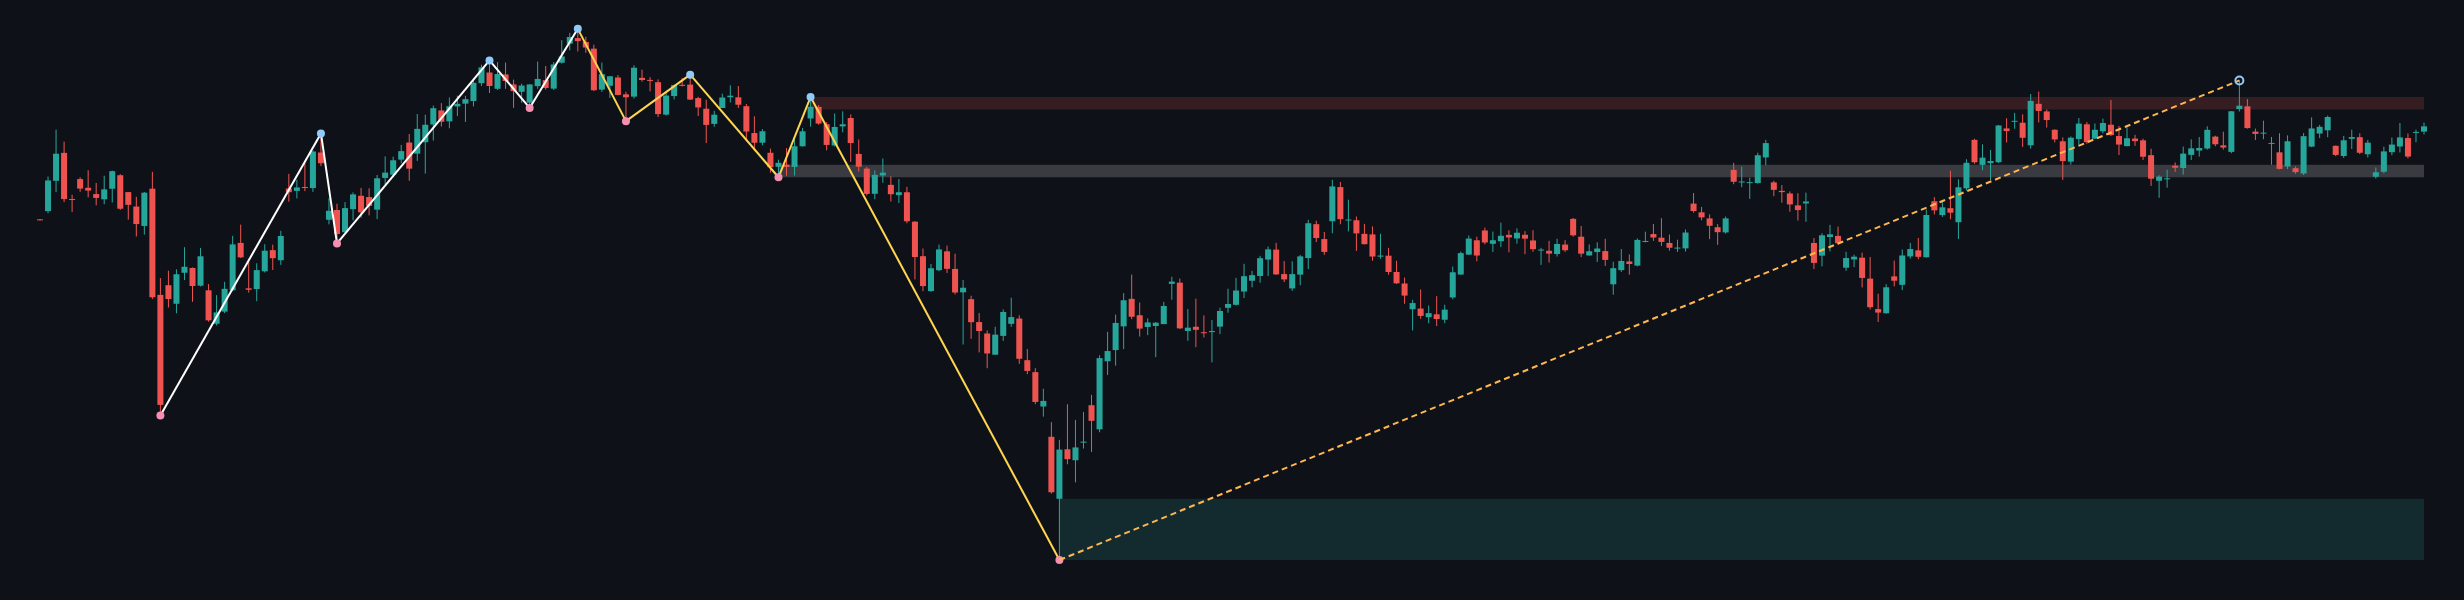
The weekly chart presents a firm downtrend, while the sub-trend is up. The most recent confirmed weekly swing is a low at 1.03535, and the report identifies no current structure event. This combination suggests that the recovery phase has not yet changed the dominant weekly direction.
Price is trading above the broken-retest weekly resistance zone at 1.31602–1.32514, which now serves as an important structural reference below the market. The nearer weekly resistance zone is 1.36575–1.37487. A sustained move through the daily ceiling could therefore open room toward that higher-timeframe supply area, while failure near 1.35308–1.35580 would keep the broader range framework intact.
The weekly ATR is 0.01825, substantially wider than the daily ATR of 0.00545. That contrast reinforces the distinction between a contained daily consolidation and the larger weekly swings. The major weekly support zone is 1.03535–1.08025, far below current price and therefore a strategic rather than immediate reference.
On the weekly chart, the principal question is whether the upward sub-trend can develop beyond the daily resistance zone. Until that occurs, the dominant downtrend remains the governing context.
Main-frame structure
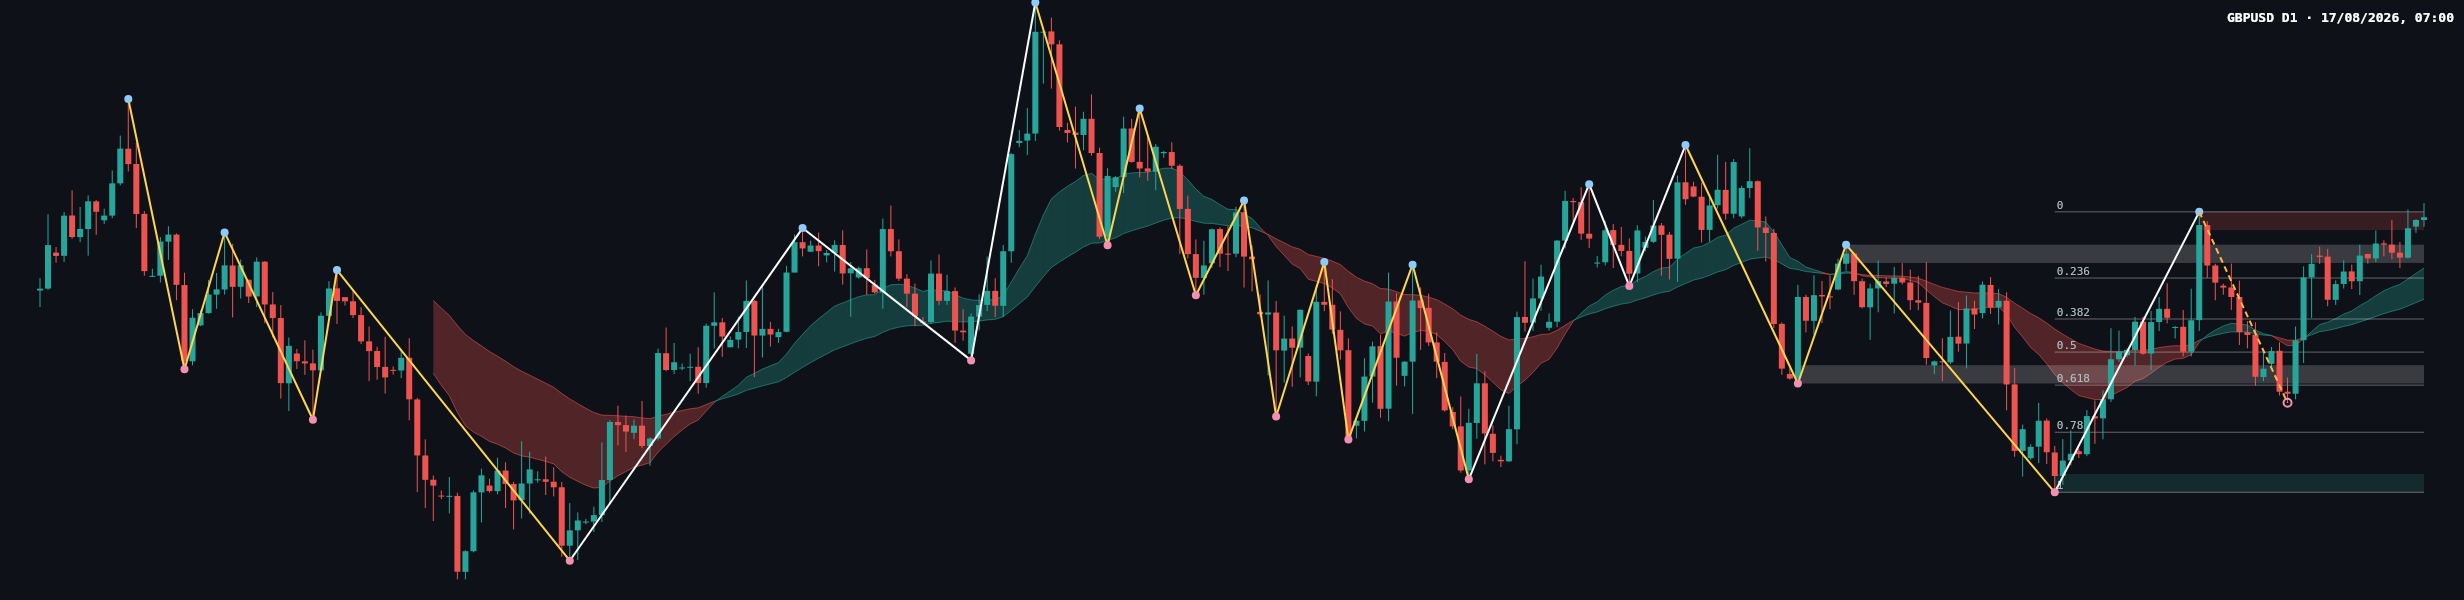
The daily trend is firmly sideways, and it does not align cleanly with the weekly downtrend. The daily chart is therefore best read as a consolidation inside a larger recovery phase, rather than as a confirmed reversal of the weekly direction. The most recent confirmed daily swing is a high at 1.35580, matching the upper boundary of the active daily resistance zone.
The daily structure report records no structure event. That means neither the bullish nor bearish interpretation has received a fresh confirmed break. The market is pressing against resistance, but pressure alone is not confirmation of acceptance above it.
Below price, the first structural reference is the broken-retest support zone at 1.34818–1.35090. A move into that area would test whether the recent recovery is being supported on pullbacks. Beneath it, the Fibonacci and daily support structure become progressively more important, beginning with 1.34592, 1.33981, 1.33487, and 1.32994.
Key levels and Fibonacci map
- 1.35308–1.35580: immediate daily resistance and the current decision zone.
- 1.34818–1.35090: broken-retest support and the first downside reference.
- 1.34592: Fibonacci level marked 0.236.
- 1.33981: Fibonacci level marked 0.382.
- 1.33487: Fibonacci midpoint marked 0.5.
- 1.32994: Fibonacci level marked 0.618, aligned closely with the broken-retest resistance zone at 1.33019–1.33291.
- 1.32291: Fibonacci level marked 0.786.
- 1.31395: Fibonacci endpoint marked 1 and the lower boundary of daily support.
- 1.36575–1.37487: higher-timeframe resistance above the current range.
The latest completed Dow leg runs from 1.35580 to 1.31395. The current retracement ratio is 0.019, indicating that price is very close to the upper endpoint of that measured leg. This keeps 1.35580 especially important: acceptance above it would strengthen the recovery case, while rejection would preserve the range and expose the support structure below.
Scenarios
Primary scenario: rejection and continued consolidation
If price remains capped by 1.35308–1.35580, the most consistent interpretation is continued daily range behavior. A retreat toward 1.34818–1.35090 would be a test of the nearest broken-retest support. The scenario is invalidated by sustained acceptance above 1.35580. Its estimated probability is not numerically quantified in the deterministic report.
Secondary scenario: bullish continuation through resistance
If the daily market closes above 1.35580 and holds that area on a subsequent retest, the recovery could extend toward the weekly resistance zone at 1.36575–1.37487. This would not, by itself, erase the firm weekly downtrend, but it would show that the weekly upward sub-trend is gaining traction. The scenario is invalidated by a return below 1.35308–1.35580 after the attempted break. Its estimated probability is not numerically quantified in the deterministic report.
Risk scenario: deeper daily retracement
If price breaks below 1.34818–1.35090, the decline could extend through the Fibonacci references at 1.34592, 1.33981, and 1.33487. A more substantial retracement would bring 1.32994, 1.32291, and the support zone at 1.31395–1.31667 into focus. This bearish scenario is weakened if price reclaims 1.35308–1.35580. Its estimated probability is not numerically quantified in the deterministic report.
What to monitor
The central checklist is the interaction with 1.35308–1.35580 and the response around 1.34818–1.35090. Above the range, the next higher-timeframe reference is 1.36575–1.37487. Below the first support, the Fibonacci sequence from 1.34592 through 1.31395 provides a map of potential retracement areas.
The cleanest confirmation would be a daily close beyond the active resistance or support zone followed by evidence that the broken boundary is being accepted rather than immediately rejected. False breaks remain a material risk because the daily trend is sideways and no structure event has been recorded.
No news or economic-calendar context was supplied in the deterministic report. Traders should therefore remain aware that external catalysts can invalidate a technical range quickly. General risk controls remain important, including avoiding excessive exposure, recognising the possibility of slippage, and allowing for the daily ATR of 0.00545 and the wider weekly ATR of 0.01825.
Summary
- GBPUSD is sideways on the daily frame at 1.35499.
- The immediate decision zone is 1.35308–1.35580.
- Initial support is 1.34818–1.35090.
- A confirmed bullish break could expose 1.36575–1.37487.
- A bearish break could bring the Fibonacci map from 1.34592 to 1.31395 into play.
The single most important thing today is whether price is accepted above or rejected from 1.35308–1.35580.
Technical analysis is provided for reference only and is not investment advice. Markets carry risk, and readers are responsible for their own decisions.