
GBPUSD is trading at a Daily close of 1.34970, close to the 1.34795–1.35090 broken-retest support zone. The higher-timeframe trend remains firmly up, although both the Weekly and Daily sub-trends are down. This leaves price in a defined decision area: acceptance above 1.35285–1.35580 would improve the short-term structure, while sustained weakness below 1.34795–1.35090 would expose lower support.
Higher-timeframe context — Weekly
The Weekly main trend is up, and the report identifies the trend as firm. However, the sub-trend is down, so the broader advance is currently undergoing a corrective phase rather than displaying uninterrupted upside momentum. The most recent confirmed Weekly swing is a high at 1.38704, with no recorded structure event.
Weekly support is marked at 1.30097–1.31346. A second area, 1.36979–1.37884, is identified as broken-retest support, while resistance is located at 1.37799–1.38704. With the last closed price at 1.34927, price is below the broken-retest area and below the broader resistance zone, rather than pressing directly against Weekly supply.
The Weekly ATR is 0.01809, indicating that the broader framework allows materially wider movement than the Daily ATR of 0.00590. The available Weekly report does not provide EMA values or a Weekly Fibonacci reading, so their exact position and interaction are not determinable from the report.
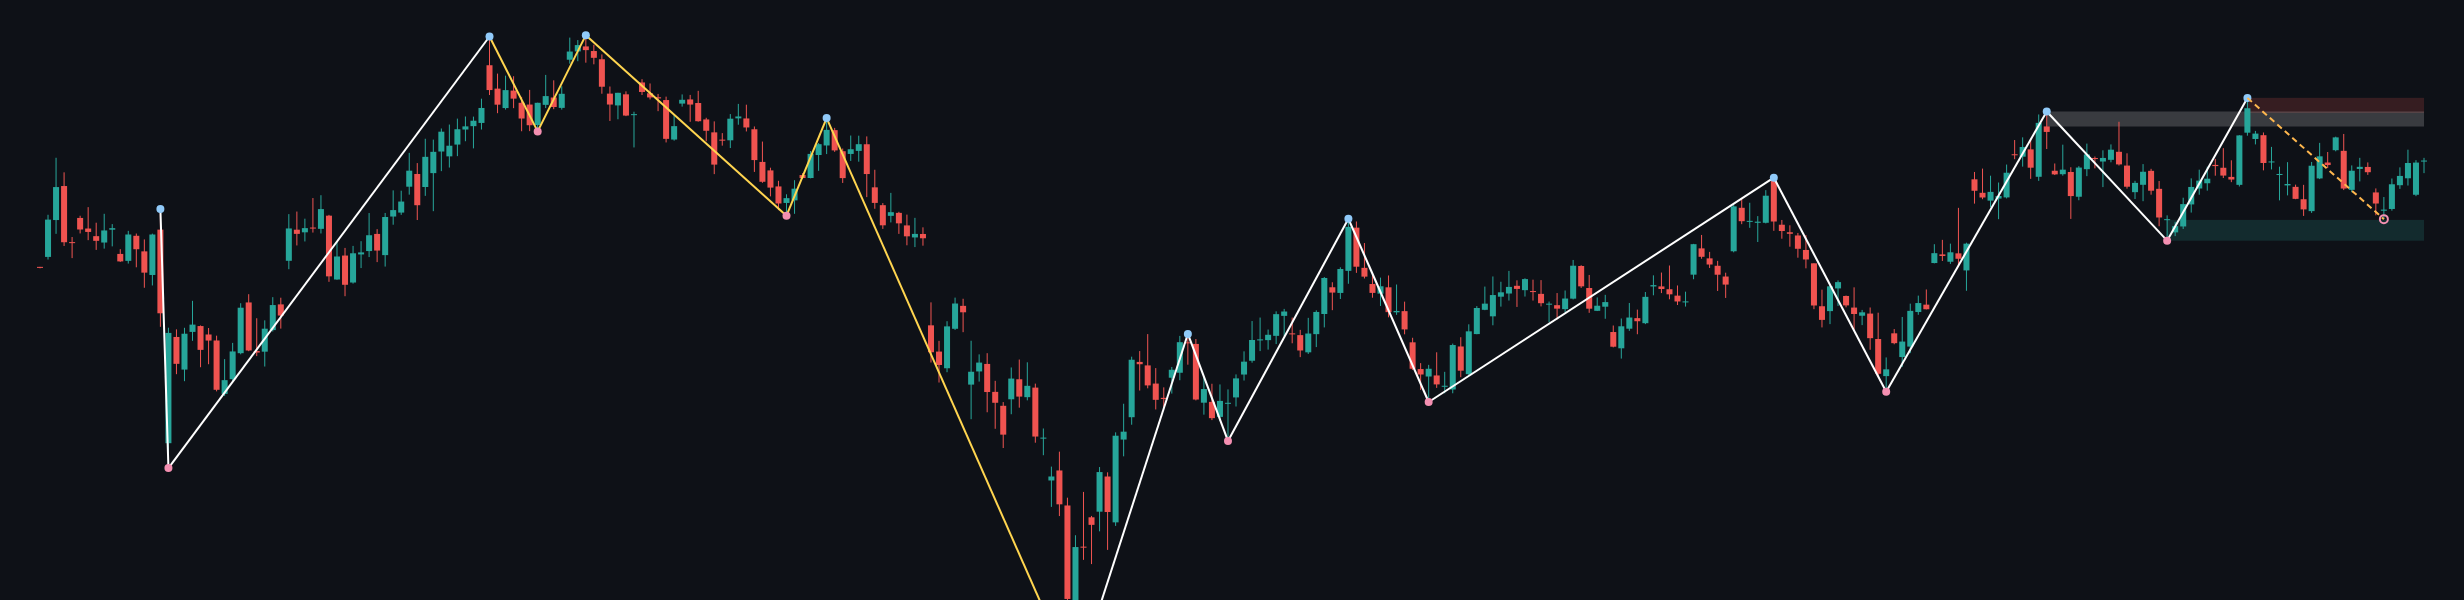
The Weekly structure permits a continuation of the larger uptrend if lower-timeframe weakness stabilizes above meaningful support. Conversely, continued rejection beneath 1.36979–1.37884 keeps the corrective sub-trend active and leaves 1.30097–1.31346 as the major lower support area.
Main-frame structure — Daily
The Daily main trend is sideways and firm, while the sub-trend is down. This does not fully align with the Weekly uptrend: the Daily picture can therefore be read as a correction or consolidation within the broader Weekly advance, although a sustained break of Daily support would increase the risk of a deeper pullback.
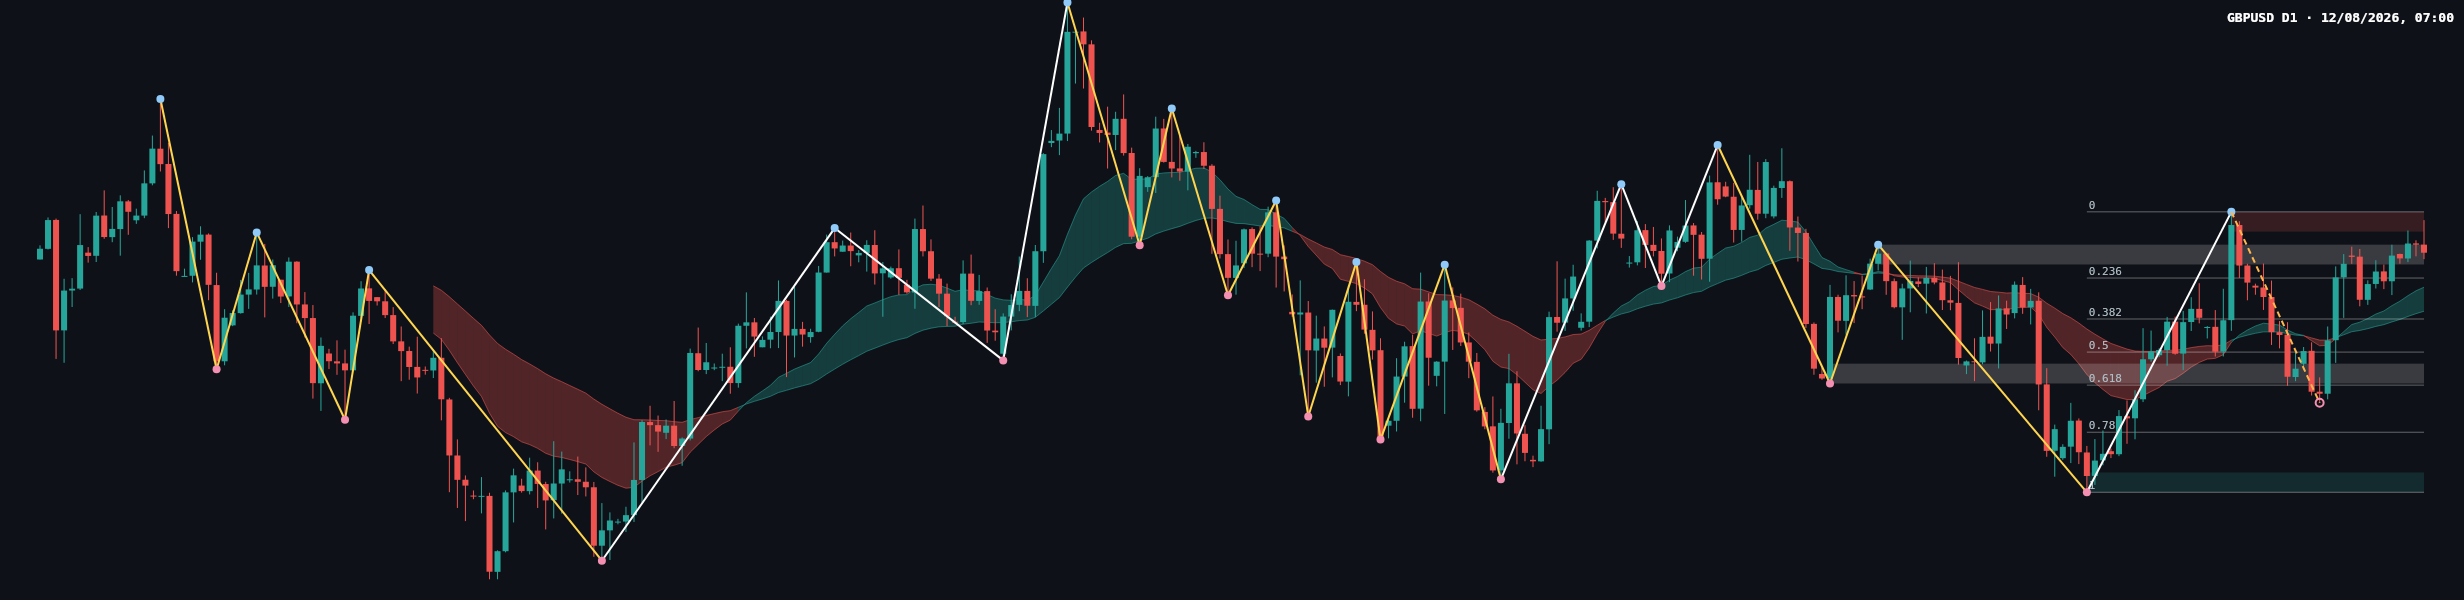
The most recent confirmed Daily swing is a high at 1.35580, and no structure event is recorded. Daily resistance is defined by 1.35285–1.35580. The nearest support area is the broken-retest zone at 1.34795–1.35090, with deeper support at 1.31395–1.31690. Another broken-retest resistance zone is marked at 1.33019–1.33314.
The latest completed Dow leg has Fibonacci levels from 0: 1.35580 through 1: 1.31395. The listed intermediate levels are 0.236: 1.34592, 0.382: 1.33981, 0.5: 1.33487, 0.618: 1.32994, and 0.786: 1.32291. The current retracement ratio is 0.146. At the latest close of 1.34970, price remains above 1.34592 and below the Daily resistance zone.
The chart shows price moving around the Daily moving-average envelope, but exact EMA values, spacing and crossover readings are not included in the deterministic report. Those details are therefore not determinable numerically. The price structure itself is clearer: the market is oscillating between nearby support and resistance without a recorded break of structure.
Key levels
| Area | Level | Role |
|---|---|---|
| Daily resistance | 1.35285–1.35580 | Upper boundary and most recent confirmed swing high |
| Daily broken-retest support | 1.34795–1.35090 | Immediate decision area |
| Daily deeper support | 1.31395–1.31690 | Lower support if the range fails |
| Fibonacci reference | 0.236: 1.34592 | First retracement reference below the current support area |
| Weekly broken-retest support | 1.36979–1.37884 | Higher-timeframe former support, currently above price |
| Weekly resistance | 1.37799–1.38704 | Major higher-timeframe supply area |
Scenarios
Primary scenario: consolidation holds
If price continues to hold the 1.34795–1.35090 area, the sideways Daily structure remains intact. A rotation back toward 1.35285–1.35580 would represent a test of the upper boundary rather than a confirmed bullish breakout. Invalidation of this range-support scenario would be sustained acceptance below 1.34795–1.35090, with 1.34592 becoming the next Fibonacci reference.
Secondary scenario: bullish range resolution
If price closes above 1.35285–1.35580 and holds that area on a subsequent retest, the Daily sub-trend would show an improvement and the high at 1.35580 would be challenged as a structural reference. The Weekly framework would then be more supportive of a recovery toward the higher-timeframe areas at 1.36979–1.37884 and 1.37799–1.38704. Invalidation would be a return below 1.34795–1.35090.
Risk scenario: support failure
If price breaks and remains below 1.34795–1.35090, the Daily down sub-trend would gain confirmation. The Fibonacci reference at 1.34592 would become relevant first, followed by the lower retracement levels at 1.33981, 1.33487 and 1.32994. The deeper support zone at 1.31395–1.31690 would become the principal lower-timeframe support reference. This bearish scenario would be weakened if price reclaims and holds 1.35285–1.35580.
Closing assessment
- The Weekly trend is firmly up, but the Weekly sub-trend is down.
- The Daily market is sideways with a down sub-trend and no recorded structure event.
- 1.34795–1.35090 is the immediate support decision area.
- 1.35285–1.35580 is the key resistance boundary and contains the most recent confirmed Daily high.
- A break below support would bring 1.34592 and the lower Fibonacci references into focus, while a break above resistance would improve the recovery structure.
The market bias is best described as range-bound with a modest bearish tilt while price remains below 1.35285–1.35580, but the broader Weekly uptrend remains an important counterweight.
This article is technical analysis and reference information only, not investment advice. Markets carry risk, and readers are responsible for their own decisions.