
GBPUSD presents a mixed-timeframe structure. The weekly trend remains firmly up, while the daily trend is sideways with a down sub-trend. The latest daily close is 1.35090, positioned at the upper edge of the daily broken-retest support zone from 1.34795 to 1.35090, but still below resistance at 1.35285–1.35580. The immediate question is whether this support area produces acceptance and recovery, or whether a renewed decline opens the way toward lower support.
Higher-timeframe context
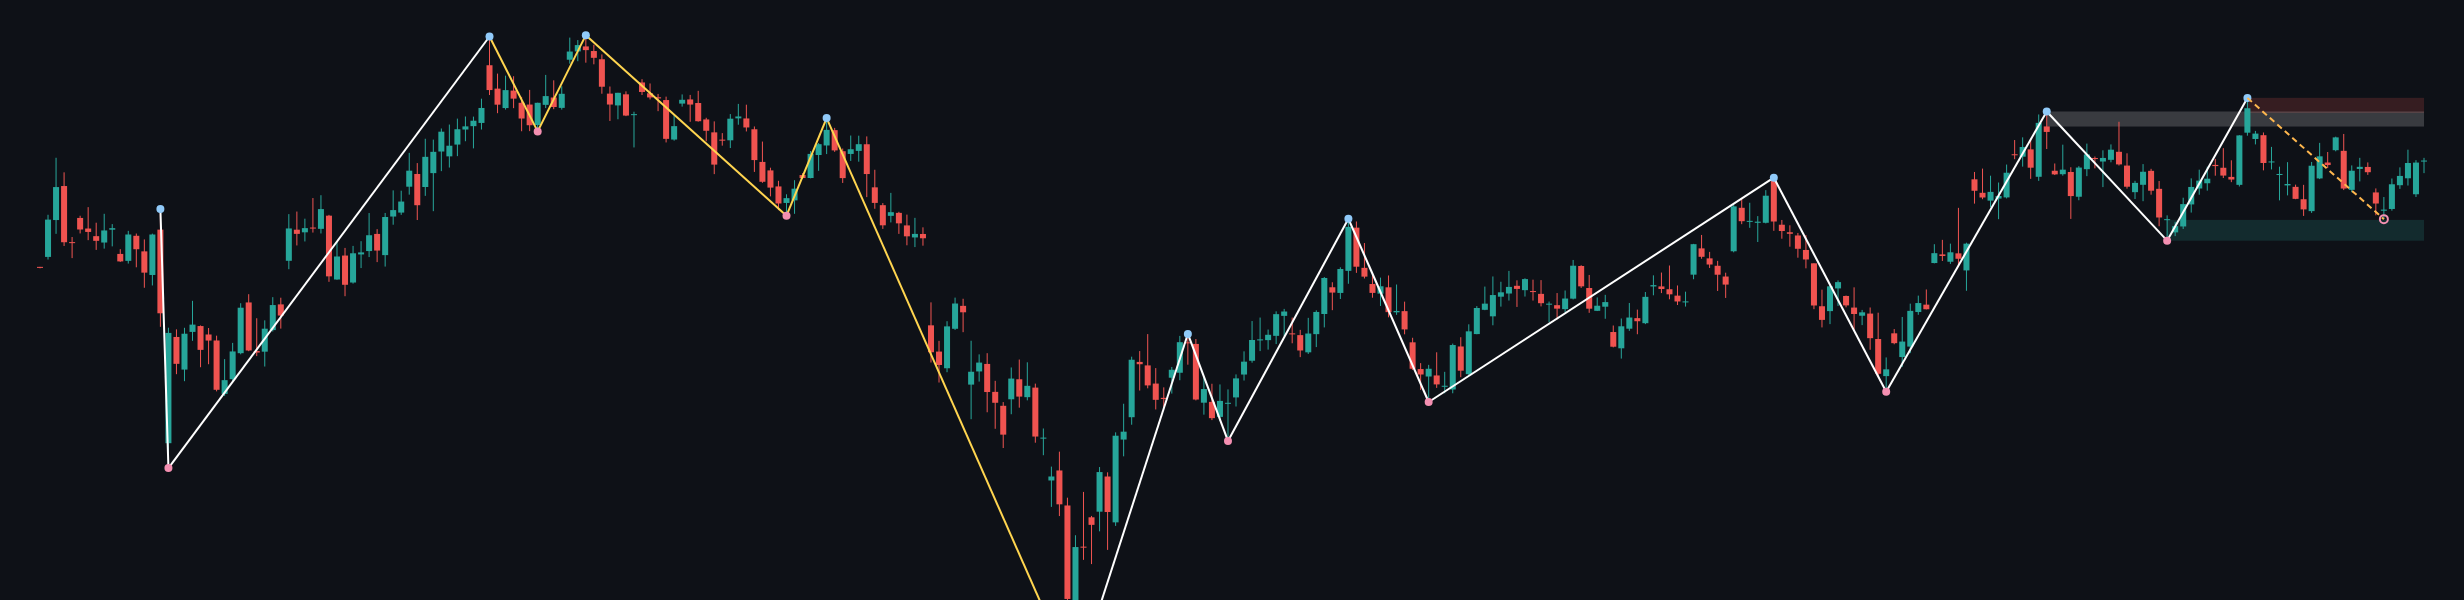
The weekly structure continues to favor the bullish side because the main trend is marked as up and firm. However, the weekly sub-trend is down, so the larger advance is currently being challenged by a corrective phase. No weekly structure event is reported, meaning there is no confirmed weekly break of structure to override the prevailing main trend.
The most recent confirmed weekly swing is the high at 1.38704. Weekly resistance is located at 1.37798–1.38704, while the broader weekly support zone is 1.30097–1.31346. A further weekly zone at 1.36978–1.37884 is identified as broken-retest support. With the weekly close at 1.34927, price is below that broken-retest area and below the weekly resistance zone, while remaining above the broader weekly support zone.
The weekly ATR is 0.01813. Weekly EMA values are not included in the deterministic report, so their exact levels, spacing and crossover status are not stated here. Weekly Fibonacci levels are also not supplied. The higher-timeframe conclusion is therefore conditional: the broader bullish framework remains intact above 1.30097–1.31346, but recovery toward 1.36978–1.37884 and then 1.37798–1.38704 would require daily resistance to be reclaimed first.
Main-frame structure
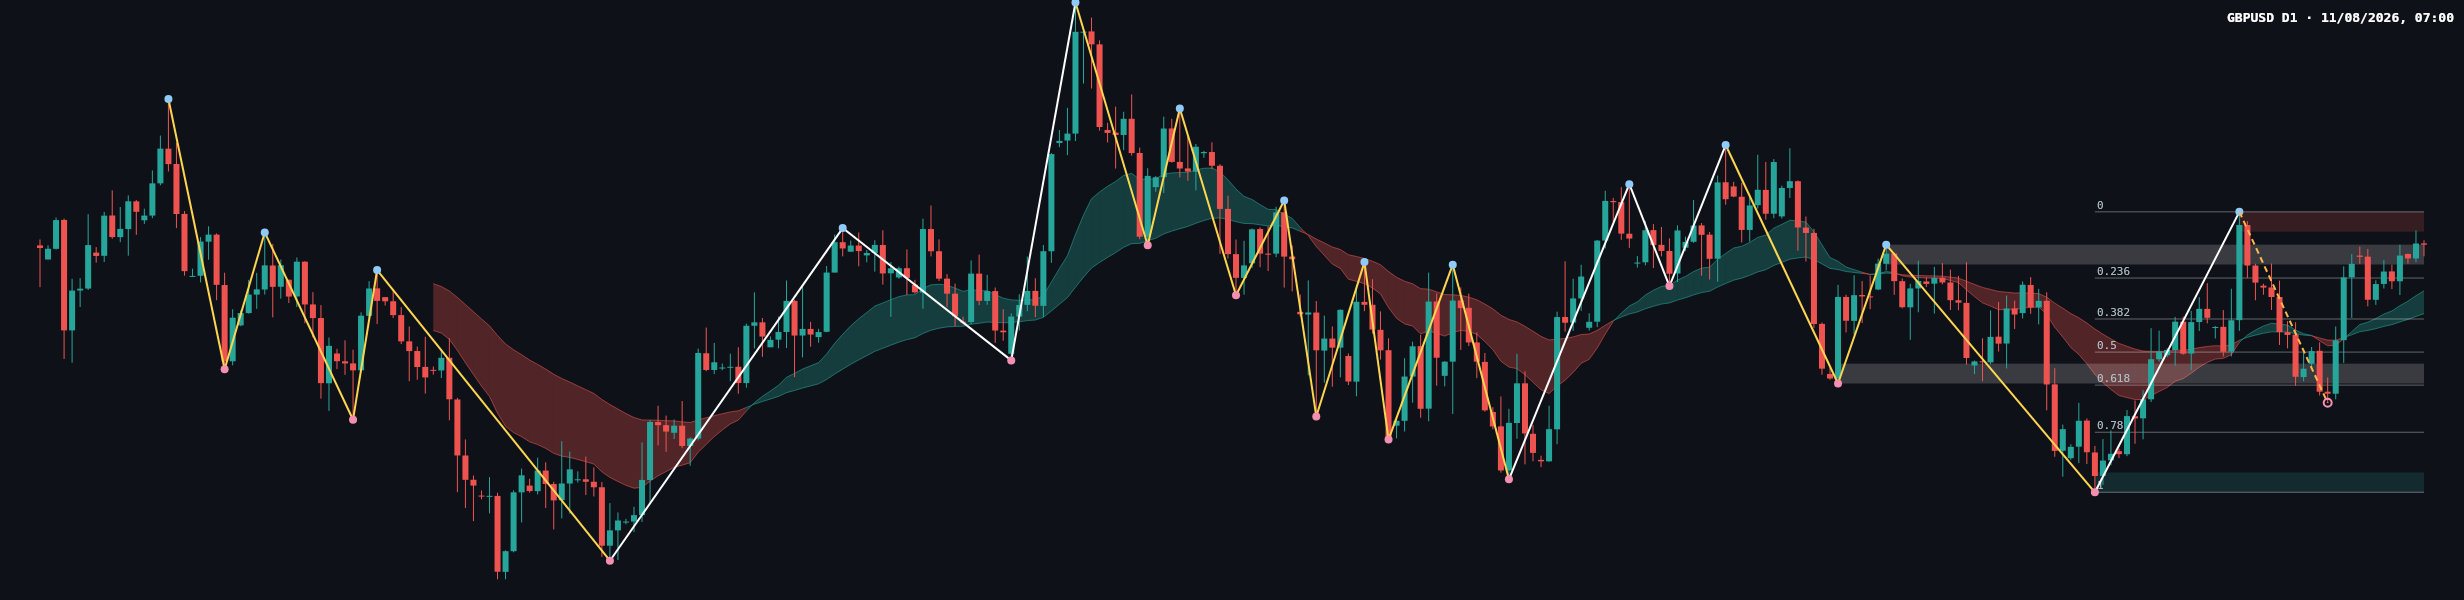
On the daily frame, the main trend is sideways and firm, while the sub-trend is down. This does not yet represent a confirmed reversal of the weekly uptrend because the report identifies no daily structure event and no weekly structure event. Instead, the daily chart is showing a range-like environment within a broader bullish context.
The most recent confirmed daily swing high is 1.35580. Daily resistance spans 1.35285–1.35580. The nearest daily support is the broken-retest zone at 1.34795–1.35090, followed by support at 1.31395–1.31690. Another broken-retest resistance zone is located at 1.33019–1.33314.
The daily ATR is 0.00591. Exact daily EMA values are not provided, so price position relative to the averages can only be discussed qualitatively from the chart rather than assigned numerical levels. The price action remains capped by 1.35285–1.35580 and supported by 1.34795–1.35090, which defines the current decision area.
Key Fibonacci levels
The latest completed daily Dow leg has its zero level at 1.35580 and its one level at 1.31395. The reported retracement ratio is 0.117, indicating that the current recovery has retraced only a relatively small portion of that leg.
| Ratio | Level |
|---|---|
| 0.236 | 1.34592 |
| 0.382 | 1.33981 |
| 0.5 | 1.33487 |
| 0.618 | 1.32994 |
| 0.786 | 1.32291 |
The current close at 1.35090 is above the 0.236 level at 1.34592 and below the swing high at 1.35580. The nearby support zone at 1.34795–1.35090 is therefore the first area to monitor for whether buyers can maintain the recovery.
Conditional scenarios
Bullish scenario
If price holds above 1.34795–1.35090 and establishes acceptance above daily resistance at 1.35285–1.35580, the range may resolve upward. The next higher-timeframe reference would be the broken-retest zone at 1.36978–1.37884, followed by weekly resistance at 1.37798–1.38704. A sustained move back below 1.34795–1.35090 would invalidate this constructive interpretation.
Bearish scenario
If price loses 1.34795–1.35090 and remains below that broken-retest support, the daily sub-trend down would receive confirmation. The Fibonacci references below are 1.34592, 1.33981, 1.33487, 1.32994, 1.32291 and 1.31395, with broader daily support at 1.31395–1.31690. Reclaiming and holding above 1.35285–1.35580 would invalidate the immediate bearish interpretation.
Range scenario
If price remains between 1.34795–1.35090 support and 1.35285–1.35580 resistance, the sideways daily structure remains dominant. In that case, repeated reactions at the two zones would provide more information than isolated intraday probes. A confirmed close outside either zone would weaken the range interpretation; the relevant invalidation is acceptance above 1.35580 for a bullish resolution or sustained trade below 1.34795 for a bearish resolution.
Probabilities are not assigned because the deterministic report does not provide probability estimates. The daily bias is balanced to slightly cautious while price remains below 1.35285–1.35580, with the wider weekly framework still favoring the upside above 1.30097–1.31346.
Recent candle and confirmation checklist
The latest daily close is 1.35090. The report does not classify the final candle by body, wick or named pattern, so a definitive label such as pin bar, doji or engulfing candle is not assigned. Visually, the latest sequence shows a rebound from the lower daily area, but the close remains close to the 1.34795–1.35090 support boundary and below 1.35285–1.35580 resistance. This leaves the buyer-versus-seller contest unresolved.
- For bullish confirmation, monitor acceptance above 1.35285–1.35580 and whether former resistance can hold on a retest.
- For bearish confirmation, monitor a close below 1.34795–1.35090 and continued pressure toward 1.34592 and the lower Fibonacci references.
- For range continuation, watch for rejection from both 1.34795–1.35090 and 1.35285–1.35580 without a confirmed daily structure event.
There is no volume or momentum reading in the deterministic report, so confirmation or divergence from those measures is not stated. Traders should also account for false breaks and rapid volatility around economic news rather than treating a single move through a zone as conclusive.
Summary
- The weekly main trend is up and firm, with broader support at 1.30097–1.31346.
- The weekly sub-trend is down, and price remains below 1.36978–1.37884 and 1.37798–1.38704.
- The daily market is sideways with a down sub-trend between 1.34795–1.35090 support and 1.35285–1.35580 resistance.
- The daily Fibonacci references extend from 1.34592 through 1.31395.
- The single most important thing today is whether price is accepted above 1.35285–1.35580 or rejected below 1.34795–1.35090.
This article is technical analysis and reference information only, not investment advice. Markets carry risk, and readers are responsible for their own decisions.