
BTCUSD closed at 82920.48, with the daily chart’s firm uptrend facing a short-term pullback and the weekly chart still showing a firm downtrend. Price is near the daily 0.382 Fibonacci level at 82623.23; how it behaves around that reference and the nearby support and resistance zones may help clarify whether the pullback remains contained.
Higher-timeframe context
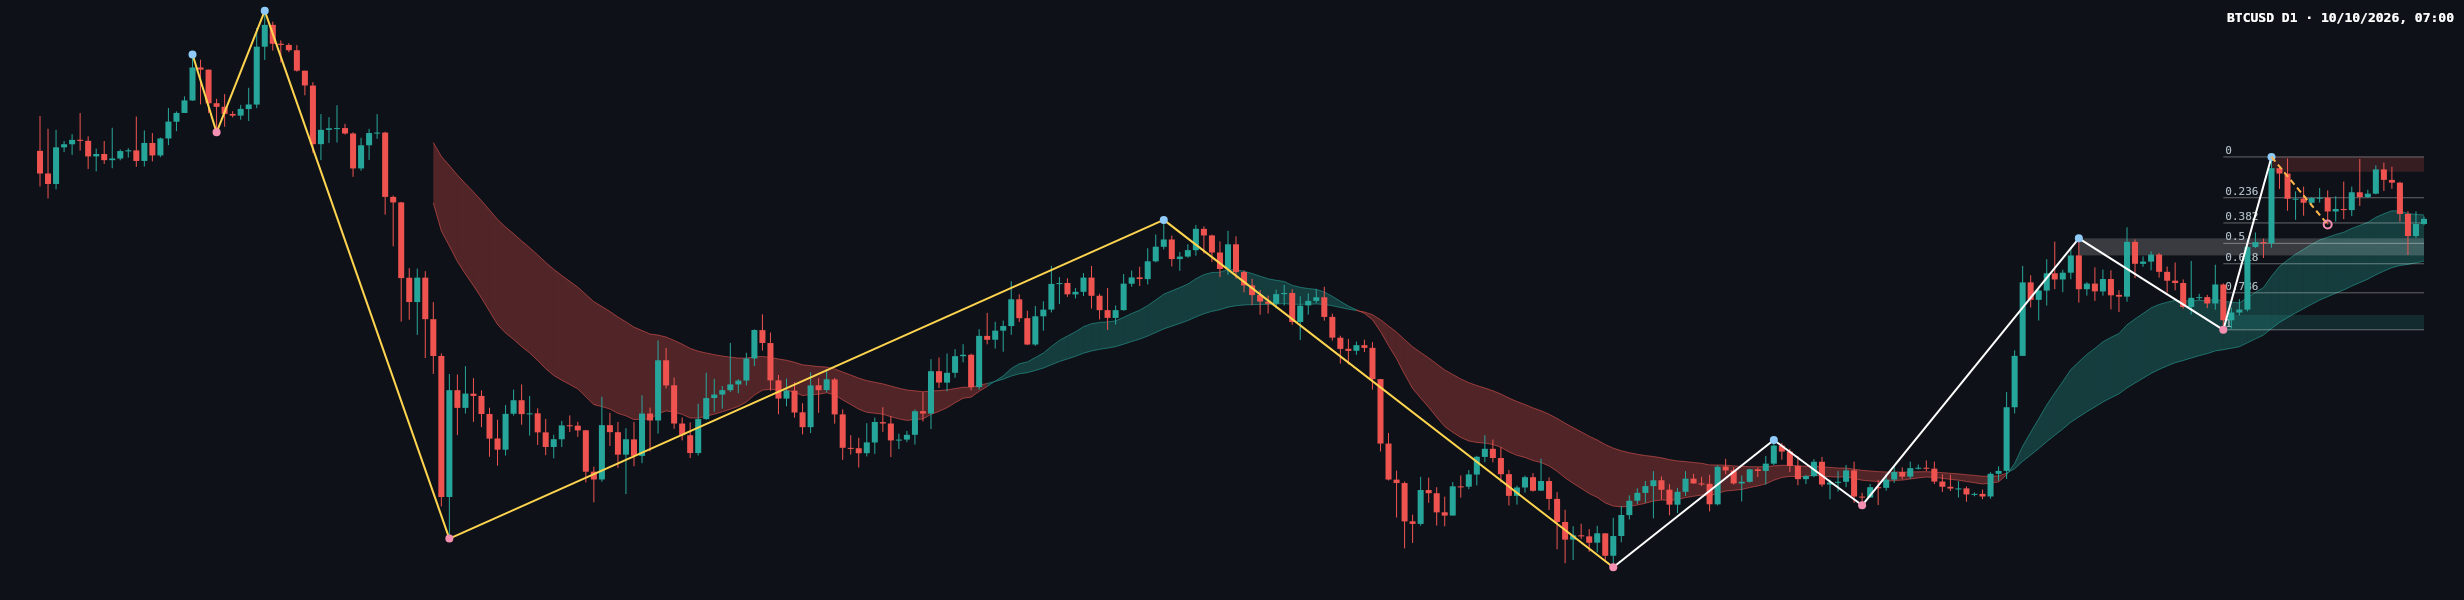
The weekly main trend is down, while its sub-trend is up. The latest confirmed weekly swing is a low at 59783.75, and the report records no new structure event. This leaves a broader bearish framework in place, even as the shorter weekly movement points upward.
The last close of 82920.48 is within the weekly broken-retest resistance zone at 80538.63 – 84683.30. A sustained hold in this area could support a further recovery attempt, while rejection and a move back beneath the zone would leave the larger downtrend in focus. Higher weekly resistance is at 94772.62 – 97971.19; the wider weekly support zone is 59783.75 – 69241.82.
The weekly report does not provide a weekly Fibonacci level, EMA readings, or an EMA relationship. Those details are therefore not determinable from the supplied data. With no weekly structure event reported, the context is better read as a recovery within a still-bearish main trend than as a confirmed trend reversal.
Main-frame structure
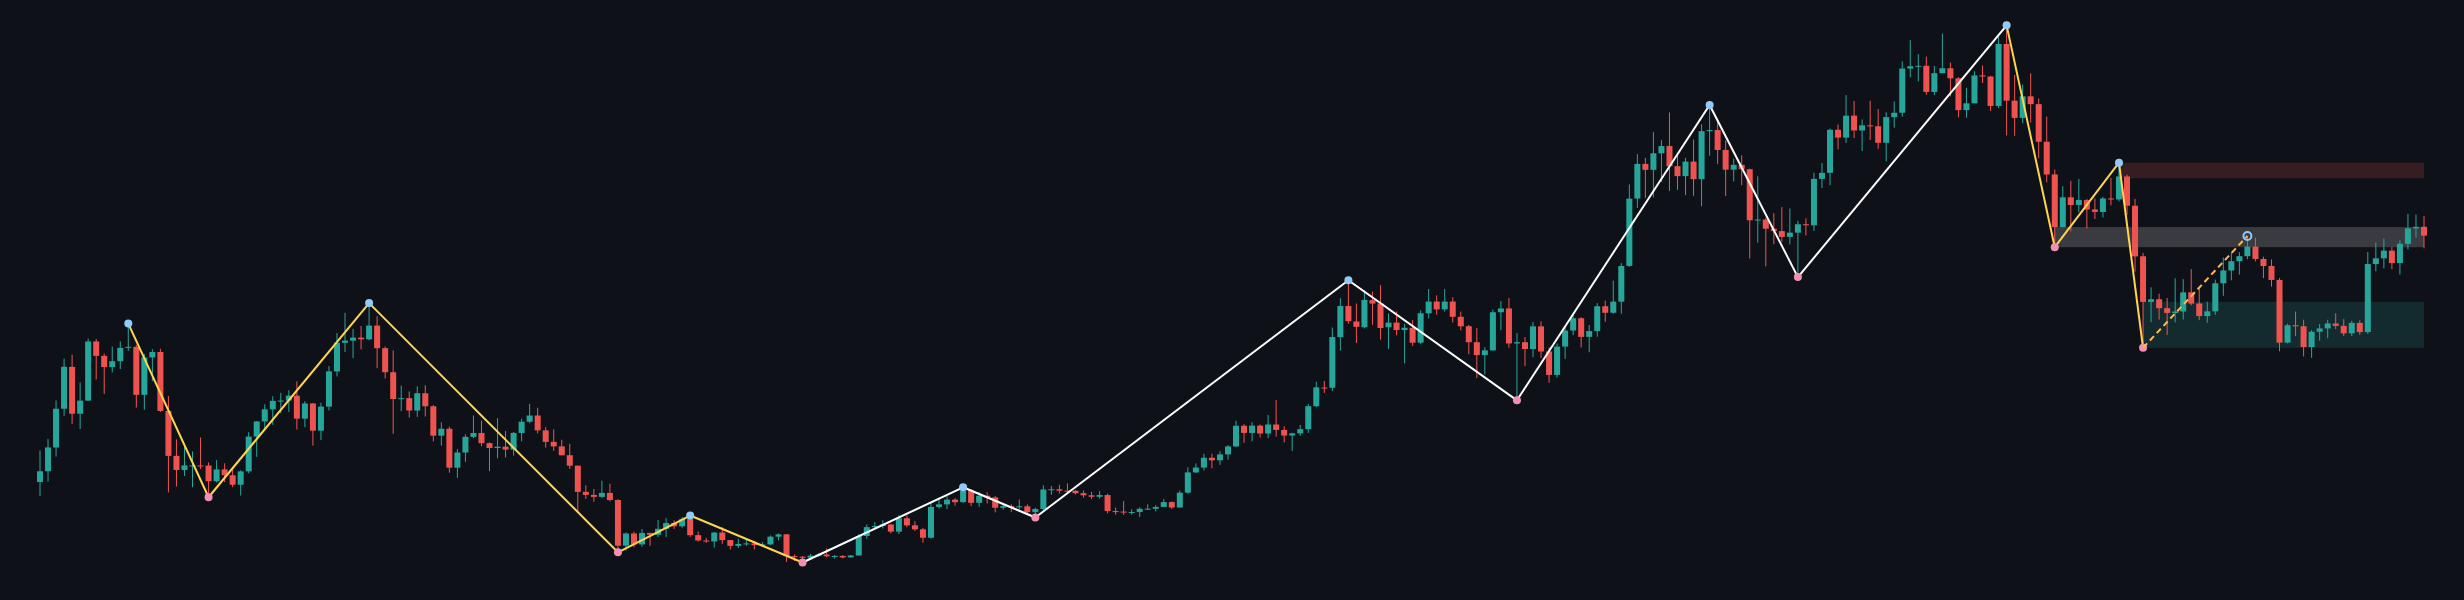
On the daily chart, the main trend is up and firm, but the sub-trend is down. That divergence is consistent with a pullback against the broader daily advance; by itself, it does not confirm a reversal. The most recent confirmed daily swing is a high at 87401.93, and no daily structure event is reported.
The latest completed Dow leg runs from 74892.24 to 87401.93. Its listed Fibonacci references are 0.236 at 84449.64, 0.382 at 82623.23, 0.5 at 81147.08, 0.618 at 79670.94, and 0.786 at 77569.31. The current retracement ratio is 0.358, placing the reported retracement between the listed 0.236 and 0.382 levels. The last close is just above the 0.382 reference; the report does not establish whether that level has held as support on a closing basis.
The chart shows a strong prior advance followed by a pullback and a recent rebound attempt. The supplied data does not include individual candle values, volume, or momentum readings, so a precise candle-by-candle assessment and volume confirmation are not determinable. EMA values and their slopes are also not included in the report.
Key levels
| Reference | Zone or level | Role in the current setup |
|---|---|---|
| Daily resistance | 86329.59 – 87401.93 | Overhead resistance, aligned with the latest confirmed daily swing high |
| Weekly broken-retest resistance | 80538.63 – 84683.30 | Weekly context zone containing the last close |
| Daily broken-retest support | 80277.00 – 81509.20 | Nearby support reference beneath the last close |
| Daily Fibonacci | 82623.23 (0.382) | Retracement reference near the last close |
| Lower daily support | 74892.24 – 75964.58 | Next listed daily support zone below |
| Higher weekly resistance | 94772.62 – 97971.19 | Broader overhead weekly zone |
Scenarios
Bullish scenario: If price holds around the 0.382 Fibonacci level at 82623.23 and moves through daily resistance at 86329.59 – 87401.93, that would strengthen the case for the daily uptrend to resume. The higher weekly resistance zone at 94772.62 – 97971.19 is a broader reference above. A move below the daily broken-retest support at 80277.00 – 81509.20 would weaken this scenario.
Bearish scenario: If price loses the daily broken-retest support zone at 80277.00 – 81509.20 and cannot reclaim it, the pullback could extend toward daily support at 74892.24 – 75964.58. A recovery through 86329.59 – 87401.93 would undermine this bearish case. The weekly downtrend provides broader context, but does not by itself confirm a daily breakdown.
Range scenario: If price remains between the nearby support references at 80277.00 – 81509.20 and resistance at 86329.59 – 87401.93, the chart would remain caught between the daily pullback and the broader recovery. A clear move beyond either zone would provide stronger evidence of directional resolution. The supplied report does not provide probability estimates, so none are assigned.
Closing view
The daily uptrend remains intact in the reported structure, but the down sub-trend and bearish weekly main trend argue for caution. The immediate question is whether price can sustain its position around 82623.23 and the nearby broken-retest support, or whether resistance at 86329.59 – 87401.93 caps a recovery attempt.
#BTCUSD #Bitcoin #TechnicalAnalysis #DailyChart #MarketAnalysis
Meta description: BTCUSD daily analysis: review the weekly trend, daily pullback, Fibonacci reference, key support and resistance, and conditional market scenarios.
This article is technical analysis for reference only and is not investment advice. Markets carry risk, and readers are responsible for their own decisions.