
BTCUSD is balancing between conflicting signals. The weekly framework remains firmly bearish after a break of 62114.40, but the daily chart is showing an upward sub-trend from the confirmed low at 57704.79. The latest closed prices are 64306.29 on the weekly context frame and 64717.40 on the daily frame, placing the market inside the broader weekly support zone of 62114.40–66104.51.
| Metric | Reading |
|---|---|
| Weekly last closed price | 64306.29 |
| Daily last closed price | 64717.40 |
| Weekly trend | Down, firm |
| Daily trend | Down, with an up sub-trend |
| Weekly support | 62114.40–66104.51 |
| Daily resistance | 81426.29–82844.58 |
| Active Fibonacci area | 63637.78 to 67308.19 |
Higher-timeframe context
The weekly chart retains a firm downtrend and a down sub-trend. Its latest confirmed swing is a high at 79521.73, while the reported structure event is a break of 62114.40. That break keeps the larger directional framework bearish unless price can reclaim and hold above the relevant resistance areas.
Price is currently inside the weekly support zone at 62114.40–66104.51. This is an important location because support can produce a stabilisation attempt, but the weekly break means the zone is not yet evidence of a confirmed reversal. The next weekly resistance zone is 75531.62–79521.73. A higher broken-retest resistance area is marked at 81113.94–85104.05.
The weekly ATR is 7980.23, indicating a materially wider context range than the daily ATR of 1878.84. That difference supports a measured reading: daily strength can develop without immediately overturning the weekly trend.
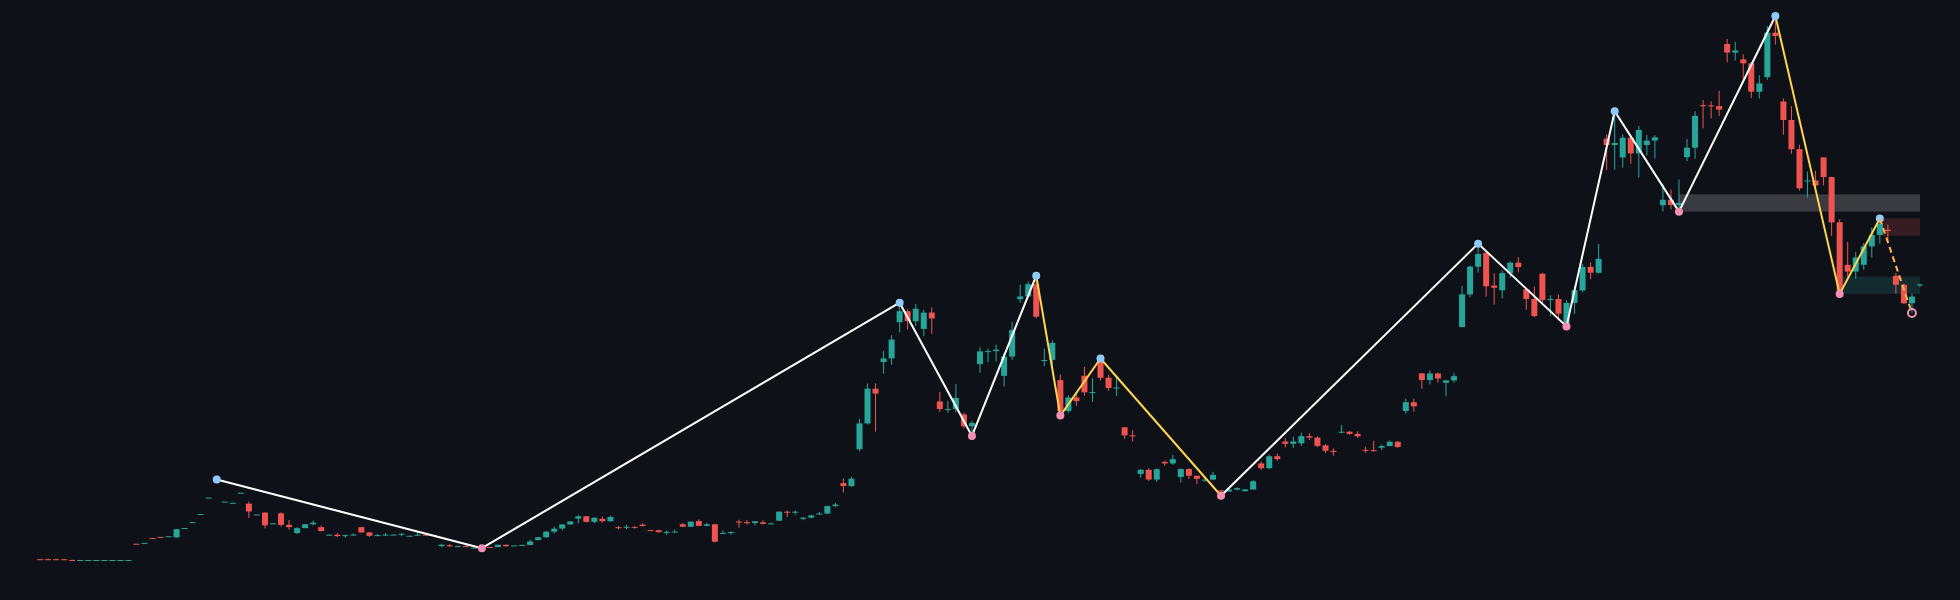
The higher-timeframe conclusion is conditional. Holding above 62114.40 keeps room for a recovery inside support, while failure below that level would reinforce the bearish structure. A sustained move through 66104.51 would improve the recovery case, but the larger resistance area at 75531.62–79521.73 remains overhead.
Main-frame structure
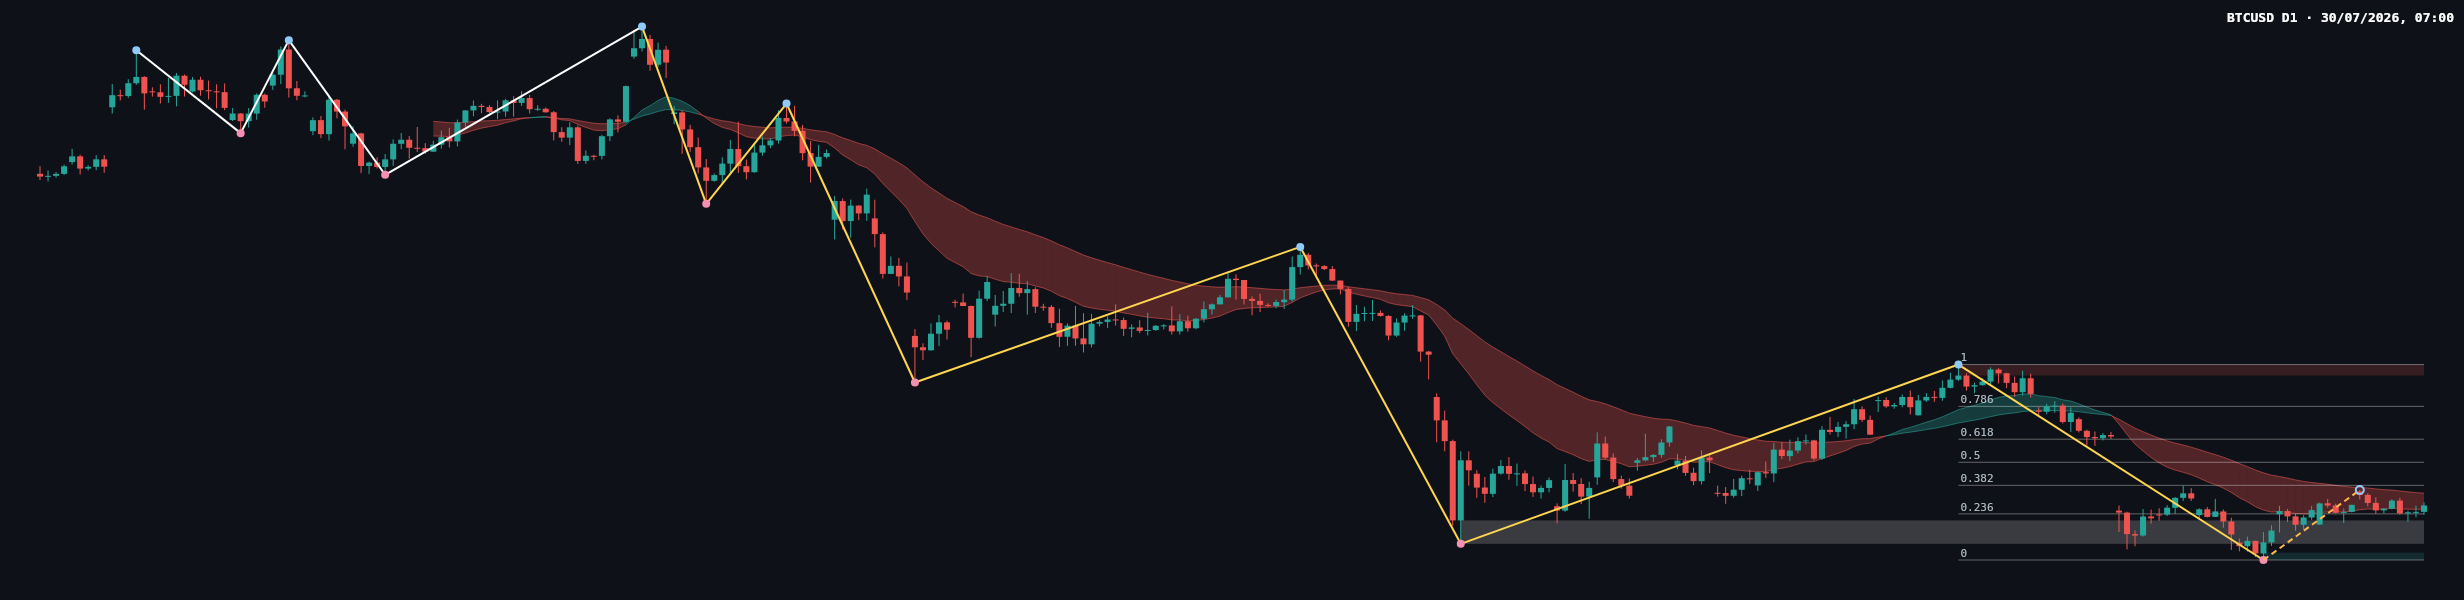
The daily main trend is down, while the sub-trend is up. This is a misalignment rather than a confirmed reversal: the upward movement can be treated as a corrective phase until the daily structure produces a clear break. The most recent confirmed daily swing is a low at 57704.79, and the report identifies no current daily structure event.
The daily chart shows a broad recovery from the support area at 57704.79–58644.21. Price is now above the broken-retest resistance zone at 59783.75–62793.85, but that reclaimed area should be monitored as a possible support reference rather than assumed to be secure. The principal daily resistance zone is 81426.29–82844.58.
The latest completed Dow leg runs from 57704.79 to 82844.58. Its Fibonacci levels are 63637.78 at 0.236, 67308.19 at 0.382, 70274.69 at 0.5, 73241.18 at 0.618, and 77464.66 at 0.786. The current retracement ratio is 0.279, placing price between 63637.78 and 67308.19.
On the visible daily chart, the latest candles show a compact consolidation after the recovery from the recent swing low. The bodies are relatively restrained compared with the earlier directional moves, and the candles cluster near the lower part of the broader rebound. This suggests that buyers have not fully surrendered the recovery, but sellers remain active near the upper boundary of the current range. The chart does not provide a volume reading in the deterministic report, so volume confirmation is not determinable from the supplied data.
Key levels and candle interpretation
The latest daily close at 64717.40 sits above 63637.78 and below 67308.19. That position leaves the market between the first and second Fibonacci retracement levels of the latest completed leg. The close is also inside the weekly support zone of 62114.40–66104.51.
The most recent candle should therefore be read in location rather than isolation. The visible consolidation does not show a decisive escape from the surrounding levels. A close that remains above 63637.78 would preserve the recovery structure, while a failure back below that level would weaken the daily rebound and shift attention toward 62114.40. A sustained move above 66104.51 would place greater emphasis on 67308.19.
Conditional scenarios
Bullish recovery scenario
- Trigger: price establishes acceptance above 66104.51.
- Target zone: the next Fibonacci area around 67308.19, with higher retracement references at 70274.69 and 73241.18.
- Invalidation: a return below 63637.78 would weaken this recovery path.
- Relative likelihood: secondary while the weekly trend remains down.
Bearish continuation scenario
- Trigger: rejection from the 66104.51 area followed by a loss of 63637.78.
- Target zone: the lower part of the weekly support structure around 62114.40, with the daily support zone at 57704.79–58644.21 as the broader downside reference.
- Invalidation: sustained trade above 67308.19 would reduce the immediate continuation case.
- Relative likelihood: primary while weekly downside structure remains intact.
Range and failed-break scenario
- Trigger: price remains between 63637.78 and 66104.51 without a decisive close beyond either boundary.
- Target zone: the same weekly support band of 62114.40–66104.51, with 63637.78 acting as the central Fibonacci reference.
- Invalidation: acceptance above 67308.19 or below 62114.40 would end the immediate range interpretation.
- Relative likelihood: plausible while the daily candles remain compressed around the current retracement area.
Key considerations
- Resistance: monitor 66104.51, 67308.19, 70274.69, and the higher zones at 75531.62–79521.73 and 81426.29–82844.58.
- Support: monitor 63637.78, 62114.40, the daily broken-retest zone at 59783.75–62793.85, and daily support at 57704.79–58644.21.
- Confirmation: the bullish case needs sustained trade above 66104.51; the bearish case needs a failure below 63637.78 and renewed pressure toward 62114.40.
- Traps: a brief move above 66104.51 that fails back into support would be a false-break risk. Conversely, a short-lived dip below 63637.78 that quickly recovers would weaken the bearish signal.
- Risk framework: traders should account for the weekly ATR of 7980.23 and daily ATR of 1878.84, avoid treating a single candle as confirmation, and apply disciplined exposure and loss-control principles.
Summary
- The weekly trend is firmly down after the structure break at 62114.40.
- The daily sub-trend is up, but no daily structure event has confirmed a reversal.
- Price is between Fibonacci references 63637.78 and 67308.19.
- The immediate decision area is the weekly support boundary at 66104.51.
- A loss of 63637.78 would favour renewed downside toward 62114.40.
The single most important thing today is whether BTCUSD can hold above 63637.78 and reclaim 66104.51, or whether the weekly support structure begins to fail.
This article is technical analysis and reference information only, not investment advice. Markets carry risk, and readers are responsible for their own decisions.