
XAU/USD retains a firm upward primary trend on the weekly frame, while the daily chart shows a downward sub-trend and a close below a former support zone. The key near-term question is whether price can reclaim 4169.312–4203.224 or whether the next test is the lower support zone at 3959.396–3993.308.
Higher-timeframe context
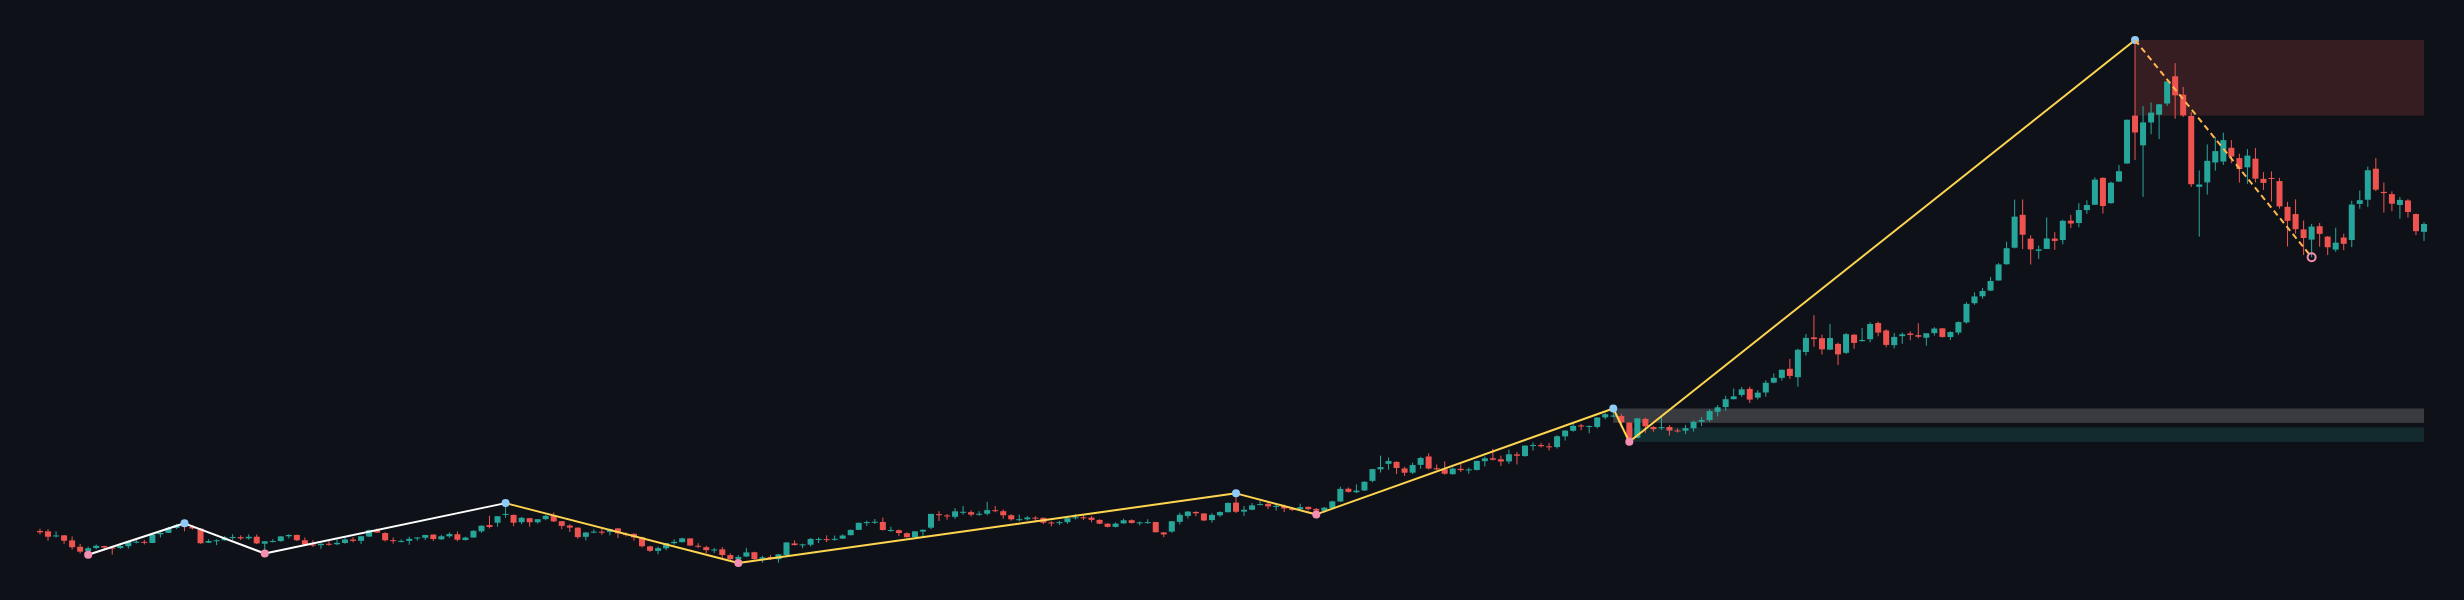
The weekly main trend is up and firm, with a downward sub-trend. The report identifies no structure event, so there is no confirmed weekly break of structure. The most recent confirmed swing high is 5595.362. The weekly chart therefore retains a constructive primary backdrop, but the pullback remains relevant until price stabilizes.
Weekly support is marked at 2536.779–2645.545, with a second, broken-retest support zone at 2681.333–2790.099. The weekly resistance zone is 5019.871–5595.362. The reported weekly close of 4195.027 is below that resistance area and above the listed weekly support zones. No weekly Fibonacci levels or EMA values are included in the report, so their position cannot be assessed here.
The weekly trend permits a recovery scenario, but it does not negate the daily pullback. The chart context remains more constructive than the current daily structure.
Main-frame structure
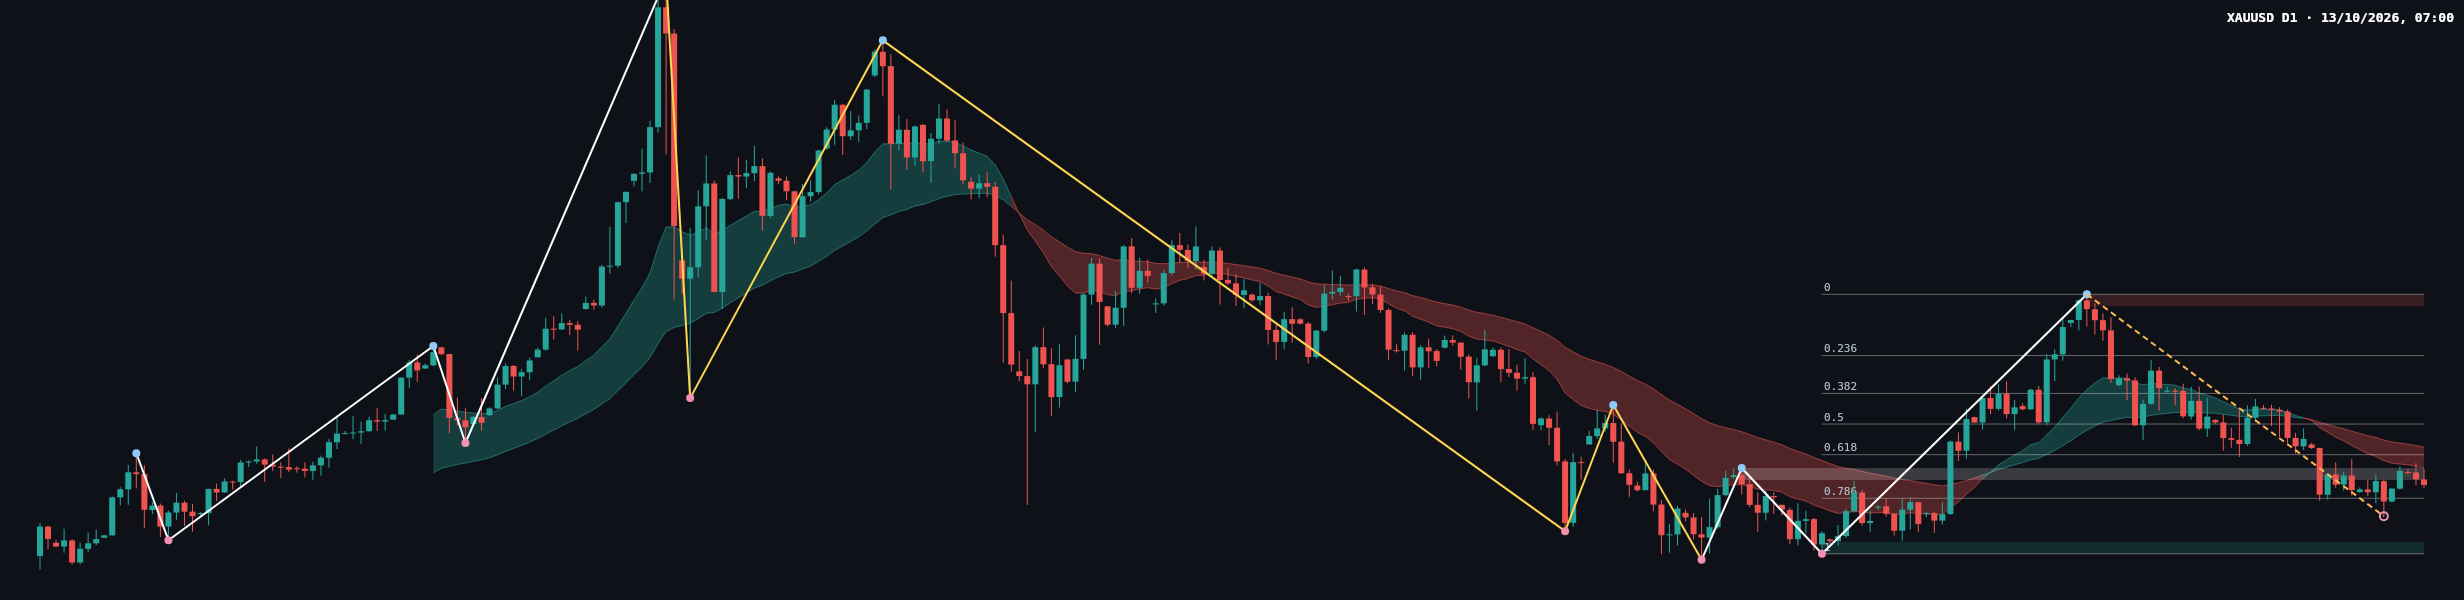
On the daily frame, the primary trend is also reported as up and firm, while the sub-trend is down. No structure event is recorded. The chart shows a decline from the confirmed swing high at 4697.097, followed by a rebound and renewed consolidation beneath the descending indicator cloud. The daily close is 4154.977, below the broken-retest zone at 4169.312–4203.224.
The latest completed Dow leg has Fibonacci levels at 4697.097 for 0, 4523.000 for 0.236, 4415.295 for 0.382, 4328.247 for 0.5, 4241.198 for 0.618, 4117.264 for 0.786, and 3959.396 for 1. The current retracement ratio is 0.735, between the 0.618 and 0.786 levels. This places the pullback in the deeper part of the measured leg, without by itself confirming a reversal.
The chart’s recent candles show price moving sideways after the downswing, with neither a clear sustained reclaim of the broken-retest zone nor a decisive extension below the latest lows. The final candle’s exact type and range are not specified in the deterministic report, so a more precise candle-by-candle reading is not justified. EMA values and volume are also not supplied; the visible descending cloud is consistent with near-term overhead pressure, but its exact readings cannot be stated.
Key levels
- 4169.312–4203.224: broken-retest support now above the daily close. A sustained recovery through this band would improve the short-term picture; failure to reclaim it would leave it as overhead resistance.
- 4117.264: Fibonacci 0.786 level, the next listed retracement reference below the reported ratio.
- 3959.396–3993.308: the daily support zone, overlapping the completed leg’s 3959.396 endpoint.
- 4241.198 and 4328.247: Fibonacci 0.618 and 0.5 references above the broken-retest band.
- 4663.185–4697.097: daily resistance, including the most recent confirmed swing high at 4697.097.
- 5019.871–5595.362: weekly resistance zone, with the upper boundary matching the most recent confirmed weekly swing high.
Scenarios
Bullish recovery: If price reclaims and holds above 4169.312–4203.224, the broken-retest zone would be back in play as support. The next listed references overhead are 4241.198 and 4328.247, with the daily resistance zone at 4663.185–4697.097 a broader hurdle. A return below 4169.312 would undermine this recovery scenario.
Bearish continuation: If price remains below 4169.312–4203.224 and falls through 4117.264, attention would shift toward the daily support zone at 3959.396–3993.308. A sustained recovery above 4203.224 would weaken this downside case.
Range and rejection: If price continues to oscillate around the broken-retest band without holding a move beyond it, the daily structure may remain unsettled. A clear hold above 4203.224 would challenge the range-bound, bearish-leaning reading; a break below 4117.264 would instead strengthen the continuation risk.
Overall, the weekly backdrop remains upward, but the daily bias is cautious while price is below 4169.312–4203.224. A sustained reclaim or a failure through 4117.264 would provide a clearer indication of which scenario is gaining traction.
This analysis is technical reference material, not financial advice. Markets involve risk, and readers are responsible for their own decisions.