
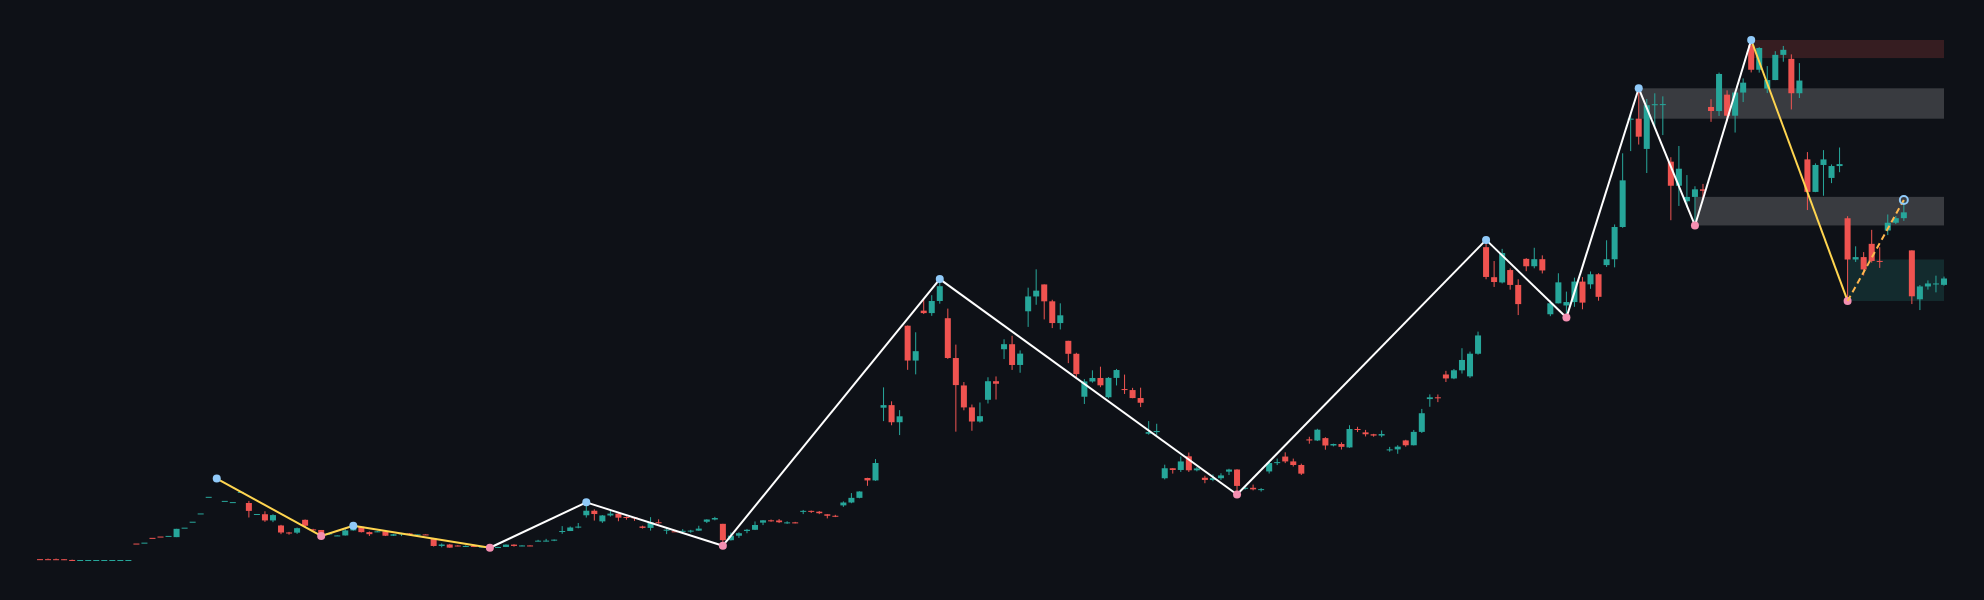
BTCUSD is balancing a firm daily downtrend against an upward sub-trend. The last closed daily price is 64845.80, while the weekly close is 64910.12. Price is currently positioned below the daily resistance zone at 66281.39 – 67264.32 and above the daily support zone at 57704.79 – 58541.32, leaving the market in a clearly defined conditional range.
Higher-timeframe context
The weekly main trend is sideways and firm, with an upward sub-trend. The most recent confirmed weekly swing is the low at 59783.75, and the report identifies no current structure event. This means the broader market has not produced a confirmed directional break, even though the recovery from that swing supports a constructive shorter-term interpretation.
Weekly price is interacting with the broad support zone at 59783.75 – 69241.82. Above the market, the broken-retest resistance zone at 77025.31 – 83539.79 is the next major structural area, followed by resistance at 115245.38 – 119361.53. The broken-retest support zone at 101400.28 – 108329.52 is also part of the larger structure but remains well above current price.
The weekly ATR is 8232.30. The report does not provide numerical weekly EMA readings, so the precise relationship between price and those averages is not determinable from the supplied data. The higher timeframe therefore permits recovery while the market remains above the weekly support area, but it does not yet establish a confirmed bullish structure break.
Main-frame structure
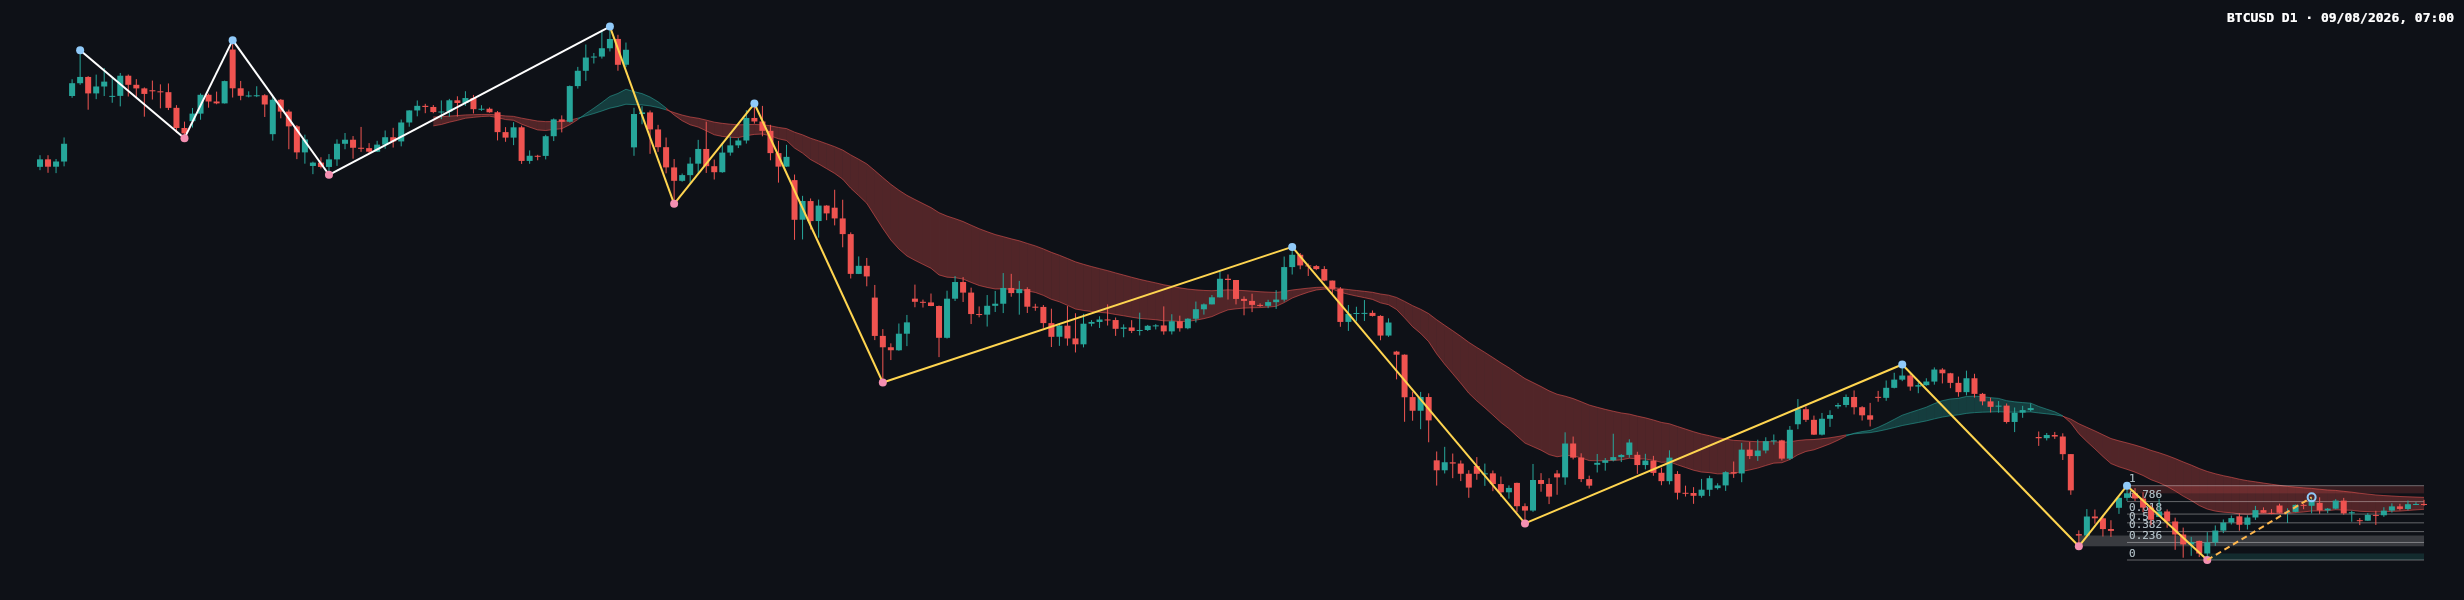
The daily main trend is down and firm, while the sub-trend is up. This is a misalignment rather than a confirmed reversal: the upward move can be treated as a recovery within the broader daily decline until price proves otherwise. No daily structure event is reported.
The latest confirmed daily swing is the low at 57704.79. The daily resistance zone at 66281.39 – 67264.32 is the immediate structural test. A sustained move through that area would improve the recovery case, while failure beneath it would keep the dominant daily trend in control.
The completed daily Dow leg runs from 57704.79 to 67264.32. Its Fibonacci levels are 59960.84 at 0.236, 61356.53 at 0.382, 62484.56 at 0.5, 63612.58 at 0.618, and 65218.58 at 0.786. The current retracement ratio is 0.747, placing price between 63612.58 and 65218.58 and below the upper end of the completed leg at 67264.32.
The daily ATR is 1464.08. Exact EMA values, their precise spacing, and any crossover are not provided in the deterministic report. The chart shows the moving-average bands, but numerical EMA levels are not determinable from the supplied data.
Key levels
| Area | Level or zone | Technical relevance |
|---|---|---|
| Current daily close | 64845.80 | Current reference point inside the daily recovery structure |
| Fibonacci area | 63612.58 to 65218.58 | Current retracement region around the reported ratio of 0.747 |
| Daily resistance | 66281.39 – 67264.32 | Immediate test for continuation of the upward sub-trend |
| Broken-retest resistance | 59472.70 – 60849.22 | Former resistance area that may become relevant if weakness returns |
| Daily support | 57704.79 – 58541.32 | Primary downside structure and location of the confirmed swing low |
| Weekly support | 59783.75 – 69241.82 | Broad higher-timeframe support area |
| Weekly resistance | 77025.31 – 83539.79 | Higher-timeframe upside reference after a confirmed daily recovery |
Scenarios
Bullish scenario
If BTCUSD closes above 66281.39 – 67264.32 and holds that area on a retest, the upward daily sub-trend would gain structural confirmation. The next broader reference would be the weekly broken-retest resistance zone at 77025.31 – 83539.79. This scenario is invalidated if price falls back below 66281.39 after the attempted breakout, particularly if the move returns toward the Fibonacci area between 63612.58 and 65218.58.
Bearish scenario
If price is rejected from 66281.39 – 67264.32 and then loses the Fibonacci reference at 63612.58, sellers would retain control of the firm daily downtrend. A deeper rotation could bring the broken-retest zone at 59472.70 – 60849.22 into focus, followed by the daily support zone at 57704.79 – 58541.32. This scenario is weakened if price reclaims and sustains above 67264.32.
Range scenario
If price remains between the Fibonacci area at 63612.58 – 65218.58 and daily resistance at 66281.39 – 67264.32, the market may continue consolidating without a confirmed structure event. Invalidation of this range interpretation would require a decisive move outside those boundaries, with the bullish resolution defined by acceptance above 67264.32 and the bearish resolution defined by a move toward 59472.70 – 60849.22.
The report does not provide statistically derived probabilities, so assigning percentage estimates would introduce unsupported data. Qualitatively, the daily bias remains cautious: the sub-trend is up, but the firm main trend is down until resistance is overcome.
Closing view
- The weekly structure is sideways and firm, with an upward sub-trend and no reported structure event.
- The daily structure remains down and firm, despite the upward sub-trend.
- 66281.39 – 67264.32 is the principal upside test.
- 63612.58, 62484.56, and 61356.53 are important Fibonacci references during weakness.
- A sustained move toward 57704.79 – 58541.32 would place the confirmed daily swing low and support structure back in focus.
The single most important consideration is whether price can achieve sustained acceptance above 66281.39 – 67264.32 or instead loses the Fibonacci recovery area around 63612.58 – 65218.58.
This article is technical analysis and reference information only, not investment advice. Markets carry risk, and readers are responsible for their own decisions.