
BTCUSD is trading at 62827.61 on the daily frame, with the higher-timeframe market classified as sideways and the daily main trend still down. The most notable feature is the contrast between price holding the weekly support zone at 62409.68 – 66537.39 and the daily sub-trend turning up beneath the next Fibonacci level at 63637.78.
Higher-timeframe context
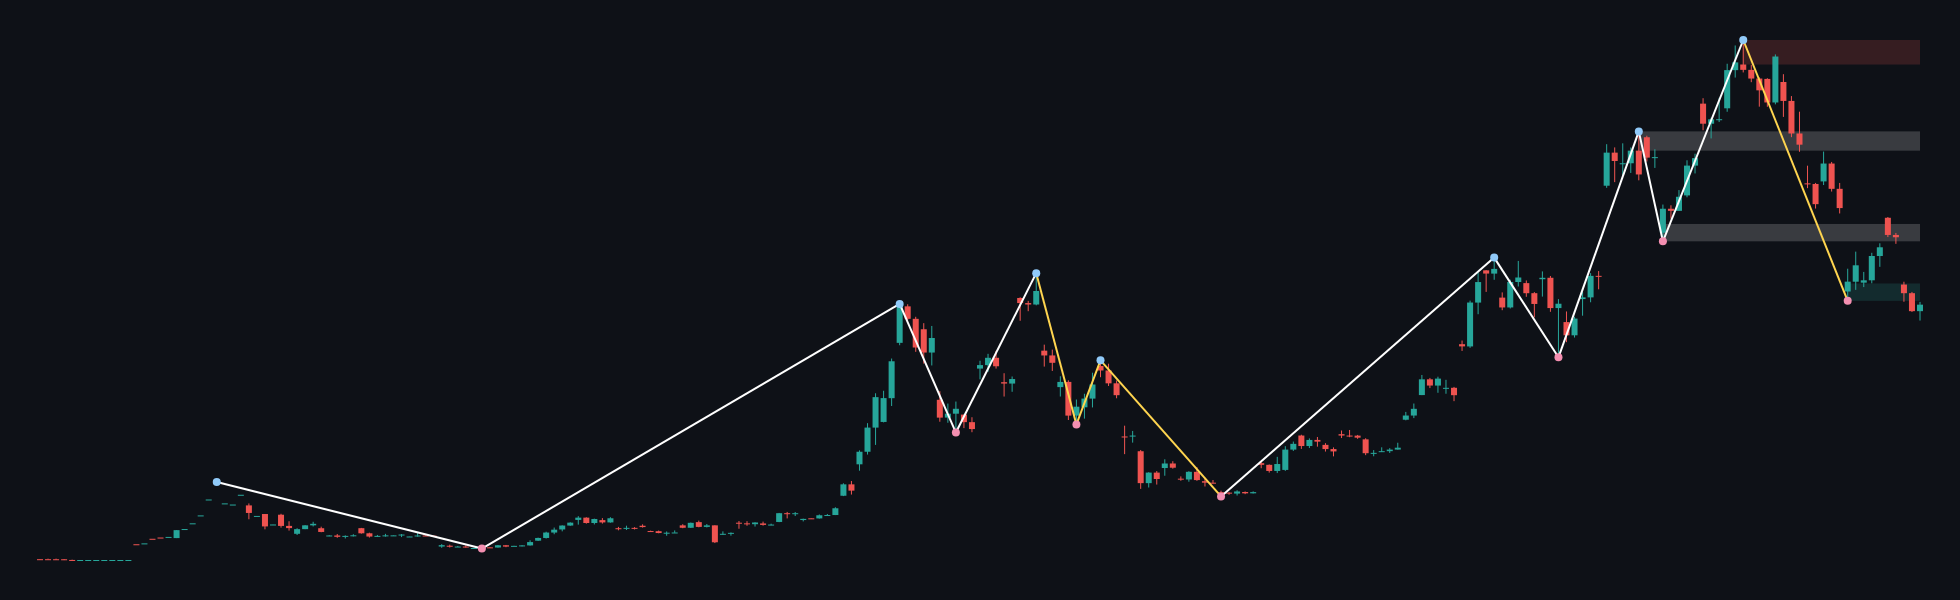
The weekly structure is sideways, with no confirmed structure event reported. The most recent confirmed weekly swing is a low at 62409.68, placing the current context near the lower part of the broader range rather than near the major resistance zone at 118723.58 – 124563.72.
The weekly support zone at 62409.68 – 66537.39 is the main area currently being tested. A separate broken-retest support zone is located at 98195.04 – 102782.35, while the broken-retest resistance zone is at 76590.80 – 80718.51. These areas define the larger range boundaries visible in the report.
Weekly moving-average positioning, slope, spacing and crossover status are not determinable from the deterministic data report. Weekly ATR is 8255.43, which indicates a substantially wider volatility environment than the daily ATR of 1886.38, although no additional calculation is made here.
There is no weekly Fibonacci reading supplied in the report. The weekly conclusion is therefore conditional: holding 62409.68 – 66537.39 allows the sideways range to remain intact, while sustained weakness beneath that zone would put the confirmed weekly swing low at 62409.68 under renewed pressure.
Main-frame structure
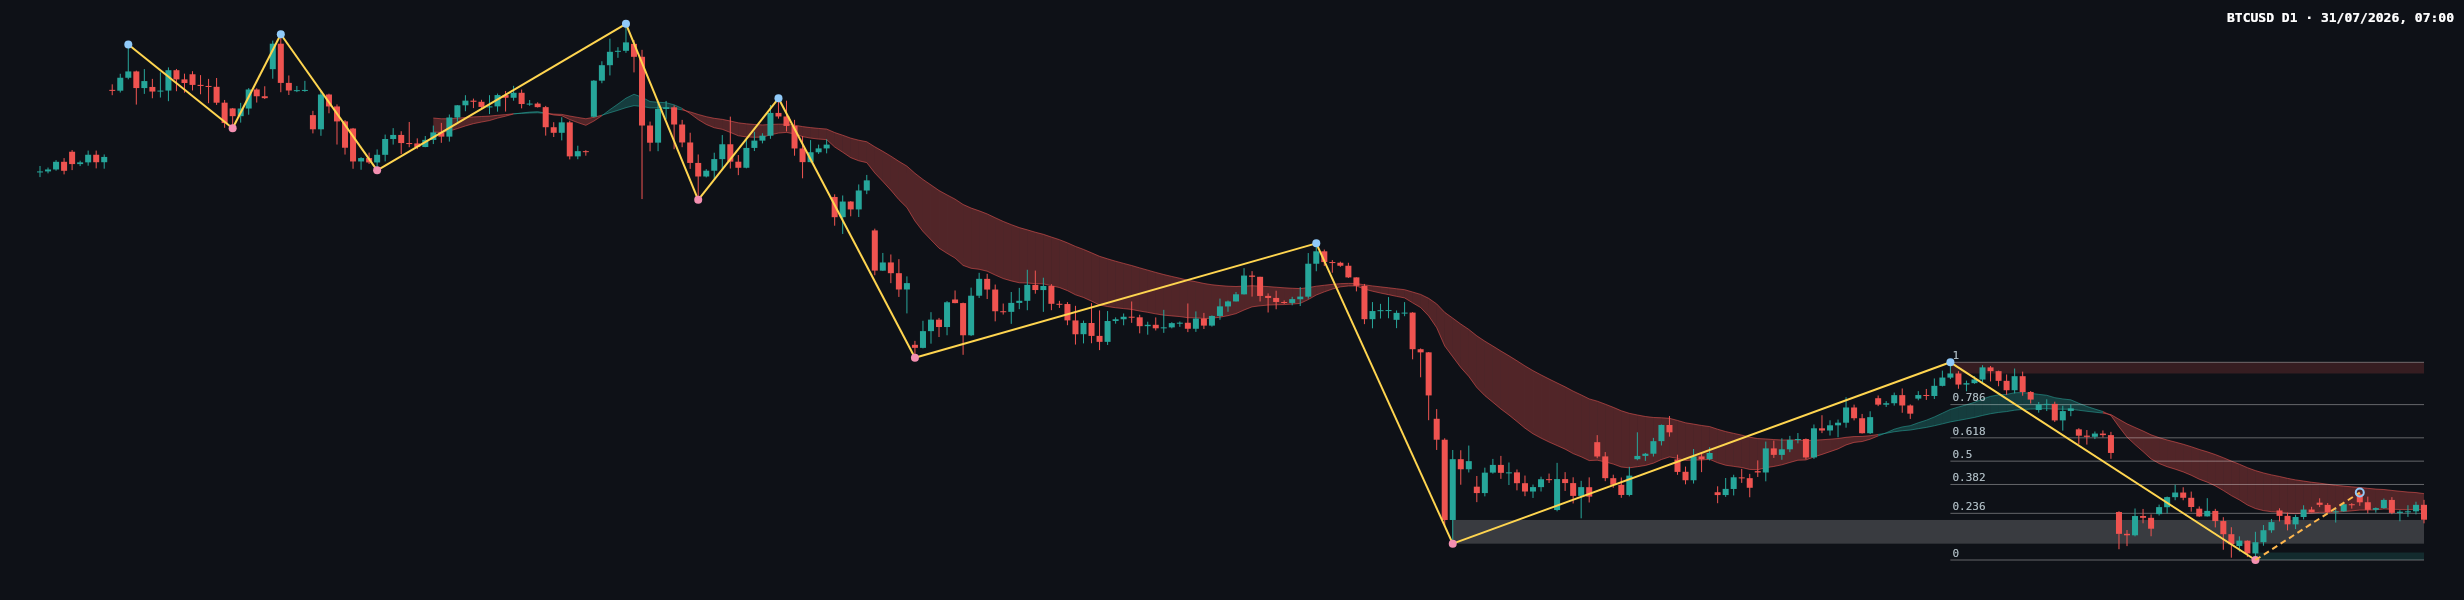
The daily main trend is down firmly, while the daily sub-trend is up. This is a divergence between the prevailing direction and the latest recovery phase, so the advance can be treated as a pullback within the broader downtrend unless price establishes acceptance above the relevant resistance and Fibonacci areas.
The daily broken-retest resistance zone is 59783.75 – 62793.85. The last closed price at 62827.61 is just above that zone, making its former upper boundary at 62793.85 an important reference for whether the recovery is being sustained or rejected.
The main daily support zone is 57704.79 – 58647.98, with the most recent confirmed daily swing low at 57704.79. The higher daily resistance zone is 81426.29 – 82844.58.
The daily Fibonacci leg runs from 0: 57704.79 to 1: 82844.58. The current retracement ratio is 0.204, below the first listed retracement level at 0.236: 63637.78. The successive reference levels are 0.382: 67308.19, 0.5: 70274.69, 0.618: 73241.18 and 0.786: 77464.66.
The daily chart shows a recovery from the area around the confirmed low, followed by consolidation beneath the latest visible swing high. Exact candle classifications, wick proportions, volume readings and moving-average values are not determinable from the deterministic report. No daily structure event is recorded.
Key levels
| Area | Level or zone | Market relevance |
|---|---|---|
| Current daily close | 62827.61 | Reference point for the present consolidation |
| Weekly support | 62409.68 – 66537.39 | Higher-timeframe demand area and location of the confirmed weekly low |
| Daily broken-retest resistance | 59783.75 – 62793.85 | Immediate retest area beneath current price |
| First Fibonacci resistance | 63637.78 | First retracement threshold above the current close |
| Further Fibonacci levels | 67308.19, 70274.69, 73241.18, 77464.66 | Potential reaction areas if recovery persists |
| Daily support | 57704.79 – 58647.98 | Main downside reference and location of the confirmed daily low |
| Higher daily resistance | 81426.29 – 82844.58 | Major resistance zone above the listed Fibonacci levels |
Scenarios
Primary scenario: recovery meets resistance
If price remains above 62793.85 and then establishes acceptance above 63637.78, the daily sub-trend would retain its upward character. In that case, the next reaction areas would be 67308.19 and 70274.69, with the broader Fibonacci sequence extending toward 73241.18. This scenario would be weakened if price falls back below 62793.85.
Secondary scenario: rejection from the retest area
If price fails to hold above 62793.85 and returns through the daily broken-retest zone at 59783.75 – 62793.85, sellers would regain control of the immediate structure. The next downside area to monitor would be 57704.79 – 58647.98. A sustained move back above 63637.78 would weaken this bearish scenario.
Risk scenario: weekly support gives way
If selling extends beneath the weekly support zone at 62409.68 – 66537.39, the weekly range interpretation would come under pressure, particularly because the confirmed weekly swing low is at 62409.68. The daily support zone at 57704.79 – 58647.98 would then become the next major reference. Reclaiming and holding 66537.39 would reduce the immediate force of this downside interpretation.
Probability percentages are not provided because the deterministic report contains no probability estimates. The near-term bias is balanced between a recovery above 63637.78 and rejection back through 62793.85; the broader daily trend still favors caution while it remains down firmly.
Closing view
- Weekly structure is sideways, with support at 62409.68 – 66537.39.
- Daily trend remains down firmly, although the sub-trend is up.
- 62793.85 is the immediate retest boundary, while 63637.78 is the first Fibonacci level above the close.
- A sustained recovery could expose 67308.19 and 70274.69.
- Failure beneath the immediate retest area would refocus attention on 57704.79 – 58647.98.
The single most important consideration is whether BTCUSD can maintain acceptance above 62793.85 and progress beyond 63637.78, or instead return through the broken-retest zone.
This article is technical analysis and reference information only, not investment advice. Markets carry risk, and readers are responsible for their own decisions.