
XAU/USD closed at 4458.279 on the daily frame, while the higher-timeframe reference shows a last closed price of 4456.173. The weekly trend remains firmly up, but the daily trend is down and shaky; the key development is that the daily chart recorded a CHoCH after breaking 4382.441, placing price above the former resistance zone at 4331.294–4382.441.
| Metric | Value |
|---|---|
| Daily close | 4458.279 |
| Weekly close | 4456.173 |
| Weekly / Daily trend | Up / Down, shaky |
| Daily structure | CHoCH; broken level 4382.441 |
| Nearest resistance zone | 4331.294–4382.441, now below price |
| Nearest support zone | 3942.138–4005.629 |
| Active Fibonacci ratio | 1.000 |
| ATR | Weekly 247.260; daily 89.638 |
Higher-timeframe context
The weekly Dow structure remains an uptrend, with the main trend described as firm and the sub-trend down. No weekly structure event is recorded. The most recent confirmed weekly swing is a high at 5595.362, so the broader advance remains the dominant framework even though the latest swing phase has moved lower.
Weekly support is marked at 2536.779–2660.409, with a further broken-retest support zone at 2666.469–2790.099. Weekly resistance is located at 5019.871–5595.362. With price at 4456.173, the market is below the weekly resistance zone and above the listed weekly support areas. The exact weekly EMA values, their spacing, and any crossover are not determinable from the deterministic report.
The weekly Fibonacci level being tested is also not determinable from the supplied weekly data. The available current retracement ratio belongs to the daily frame and is 1.000.
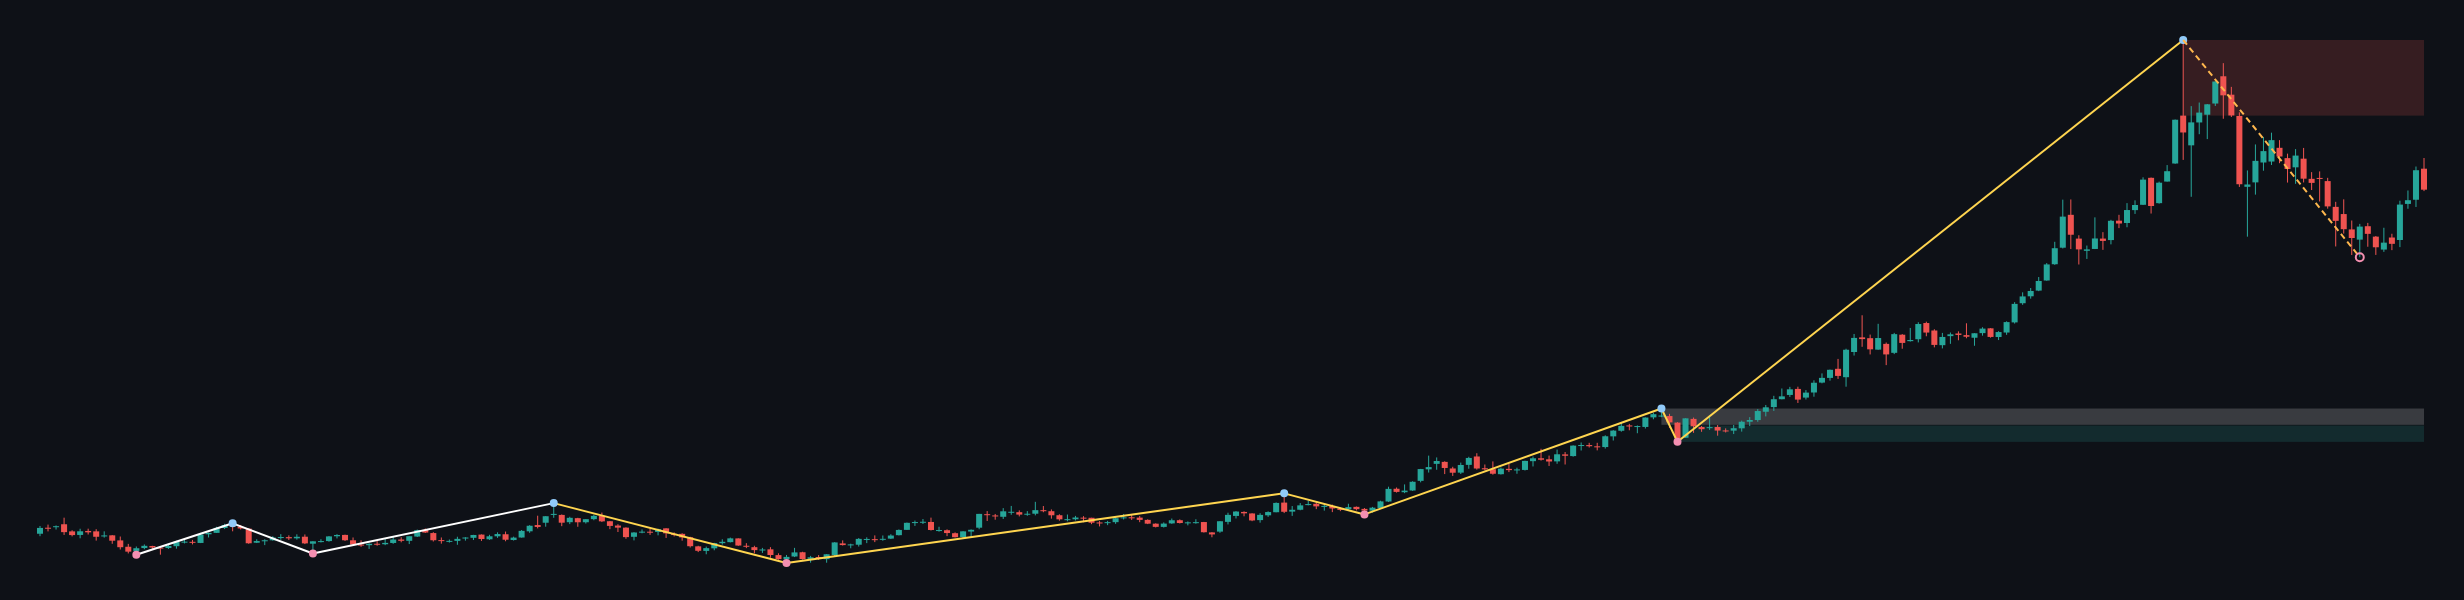
The higher timeframe therefore permits a continued corrective phase inside a broader uptrend. A sustained move above 5019.871 would place attention back on the weekly resistance area, while a move toward the weekly support zones would represent a deeper retracement rather than, by itself, a confirmed change in the weekly trend.
Main-frame structure
The daily main trend is down, but it is described as shaky, while the sub-trend is up. This does not fully align with the weekly uptrend: it can represent an early reversal attempt on the daily chart, or a countertrend recovery within the broader weekly structure.
The daily CHoCH is tied to the broken level at 4382.441. Price is now at 4458.279, above the resistance zone at 4331.294–4382.441. That positioning is constructive while the zone holds beneath the market, but a return below 4382.441 would weaken the upward interpretation and raise the possibility that the break was a false transition.
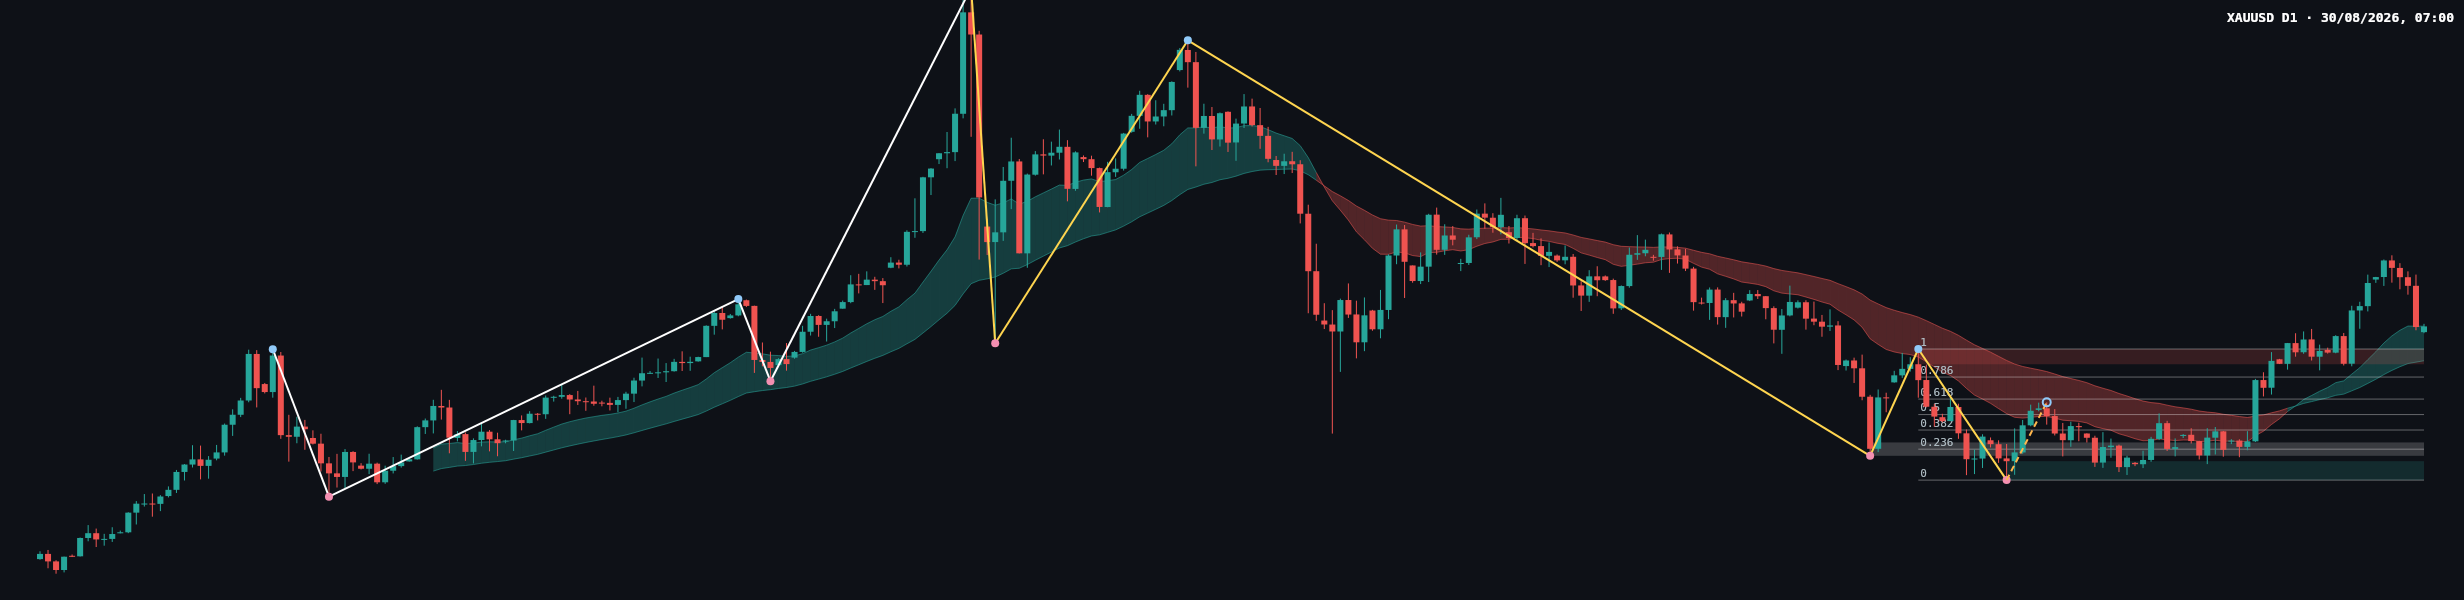
The latest completed Dow leg runs from the confirmed low at 3942.138 to 4382.441. Its Fibonacci levels are 4046.050 at 0.236, 4110.334 at 0.382, 4162.290 at 0.5, 4214.245 at 0.618, and 4288.216 at 0.786. The current retracement ratio is 1.000, indicating that price has recovered to the upper endpoint of that measured leg.
The daily EMA values are not supplied in the report, so their precise position, slope, spacing, and any crossover are not determinable. The chart does show price interacting with the moving-average bands, but exact EMA-based conclusions should remain provisional.
Recent candle behaviour
The most recent visible candles show a sharp upward recovery followed by a pullback from the local high. The latest candle appears bearish, with the close returning toward the nearby moving-average area. Its exact body-to-wick classification and precise location within the candle range are not determinable from the report.
Relative to the key daily levels, the important question is whether the pullback remains above 4382.441. Holding above that broken level would support the buyer-controlled interpretation created by the CHoCH. A daily close back below 4382.441 would instead suggest rejection of the breakout and renewed pressure toward the lower daily zones, beginning with 4023.812–4068.631 and then 3942.138–4005.629.
Key levels and conditional scenarios
- Bullish continuation: If price holds above 4382.441 and continues to build above the former resistance zone at 4331.294–4382.441, the next major higher-timeframe area to monitor is 5019.871–5595.362. This scenario is invalidated by a sustained return below 4382.441. No probability is assigned because the deterministic report provides no probability estimates.
- Bearish rejection: If price falls back below 4382.441, the CHoCH would lose follow-through and the market could revisit the broken-retest zone at 4023.812–4068.631. A deeper bearish continuation would bring the support zone at 3942.138–4005.629 into focus. This scenario is weakened by a sustained move back above 4382.441.
- Range and failed-break scenario: If price remains between the daily resistance area at 4331.294–4382.441 and the broader support area at 3942.138–4005.629, the conflicting weekly and daily structures would favour two-way movement rather than a confirmed directional resolution. This scenario is invalidated by a clear continuation beyond the listed zones.
What to monitor
- Near resistance: 4331.294–4382.441, now acting as the key retest area beneath current price.
- Higher resistance: 5019.871–5595.362, containing the most recent confirmed weekly high at 5595.362.
- Broken-retest support: 4023.812–4068.631.
- Broader daily support: 3942.138–4005.629, containing the most recent confirmed daily swing low at 3942.138.
- Confirmation condition: sustained acceptance above 4382.441 favours continuation, while a close back below it favours rejection.
The main technical trap is a false break above 4382.441 followed by a rapid return into 4331.294–4382.441. Conversely, a brief dip into that zone that is quickly reclaimed would indicate that sellers have not yet achieved sustained control. DXY, US ten-year yields, the economic calendar, and geopolitical headlines remain relevant external drivers, but no specific event time is supplied in the report.
Summary
- The weekly trend is firmly up, with price below the weekly resistance zone at 5019.871–5595.362.
- The daily trend is down and shaky, but the daily sub-trend is up after a CHoCH through 4382.441.
- The daily resistance zone at 4331.294–4382.441 is the key boundary between continuation and rejection.
- A return below 4382.441 would expose the lower zones at 4023.812–4068.631 and 3942.138–4005.629.
The single most important consideration is whether price can sustain acceptance above 4382.441 after the daily CHoCH.
#XAUUSD #GoldAnalysis #PriceAction #DowTheory #TechnicalAnalysis
Meta description: XAU/USD analysis: weekly trend remains up while daily structure turns higher after a CHoCH through 4382.441.
This article is technical analysis and reference information only, not investment advice. Markets carry risk, and readers are responsible for their own decisions.