
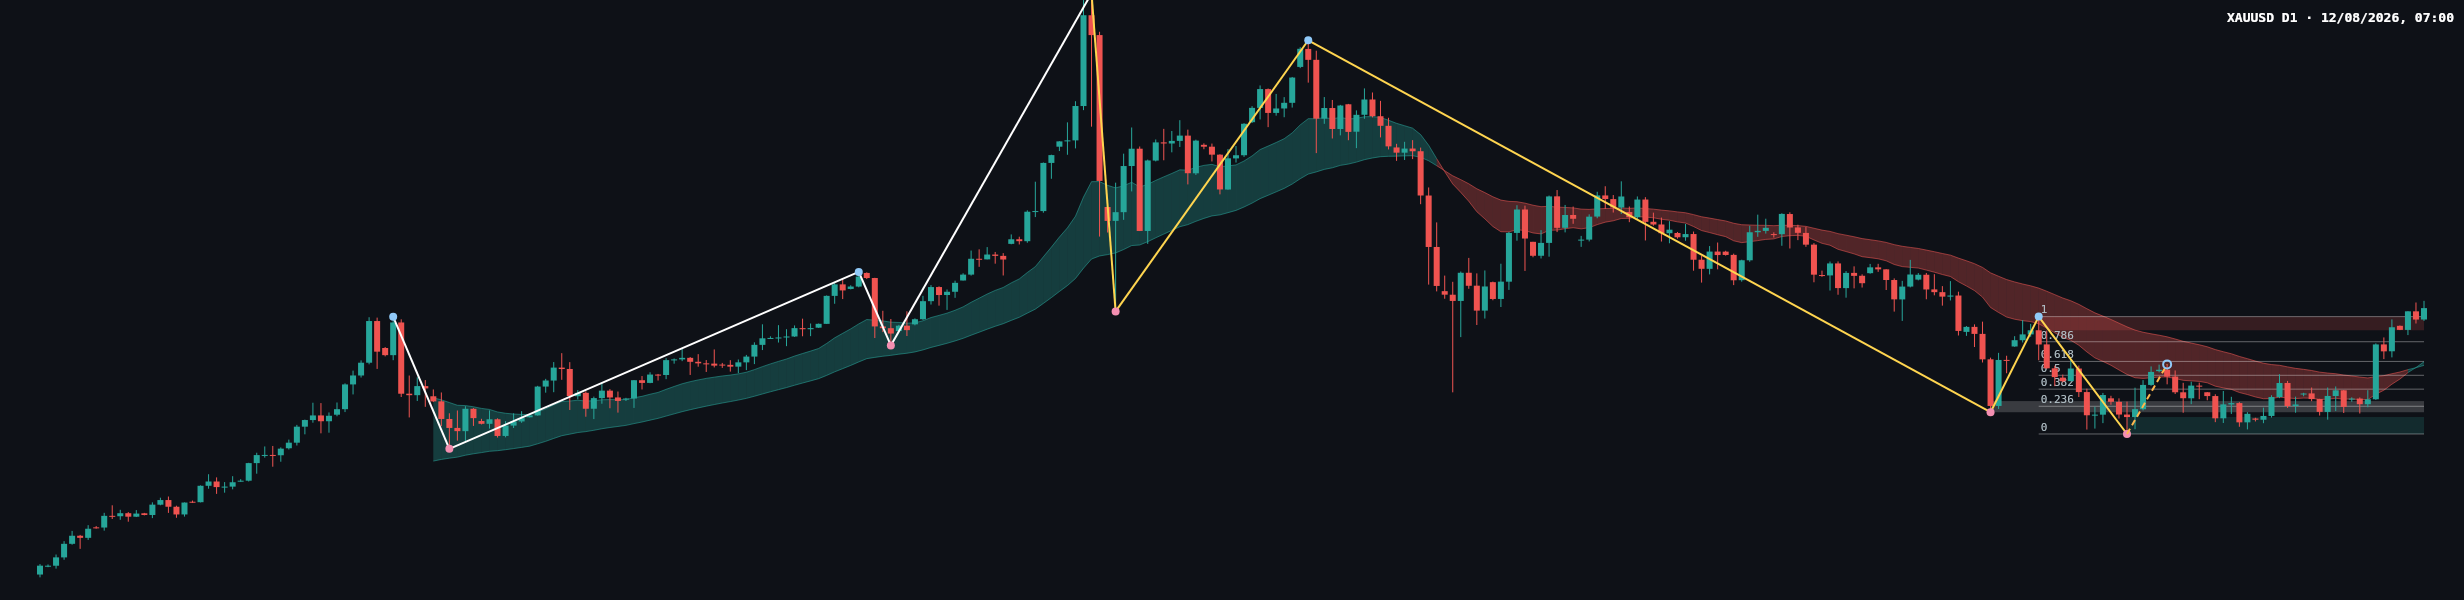
XAU/USD presents a mixed multi-timeframe picture. The weekly framework remains firmly upward, with the latest closed price at 4342.514, while the daily frame is still classified as down and shaky despite an upward sub-trend. On the daily chart, price has recovered to 4414.301 after a change of character at 4382.441, making acceptance above the former resistance area the central issue for the session.
| Metric | Reading |
|---|---|
| Weekly last closed price | 4342.514 |
| Daily last closed price | 4414.301 |
| Weekly trend | Up, firm; sub-trend down |
| Daily trend | Down, shaky; sub-trend up |
| Nearest daily resistance | 4331.294 – 4382.441, now being challenged from above |
| Daily support | 3942.138 – 4005.629 |
| Active Fibonacci ratio | 1.000 |
Higher-timeframe context
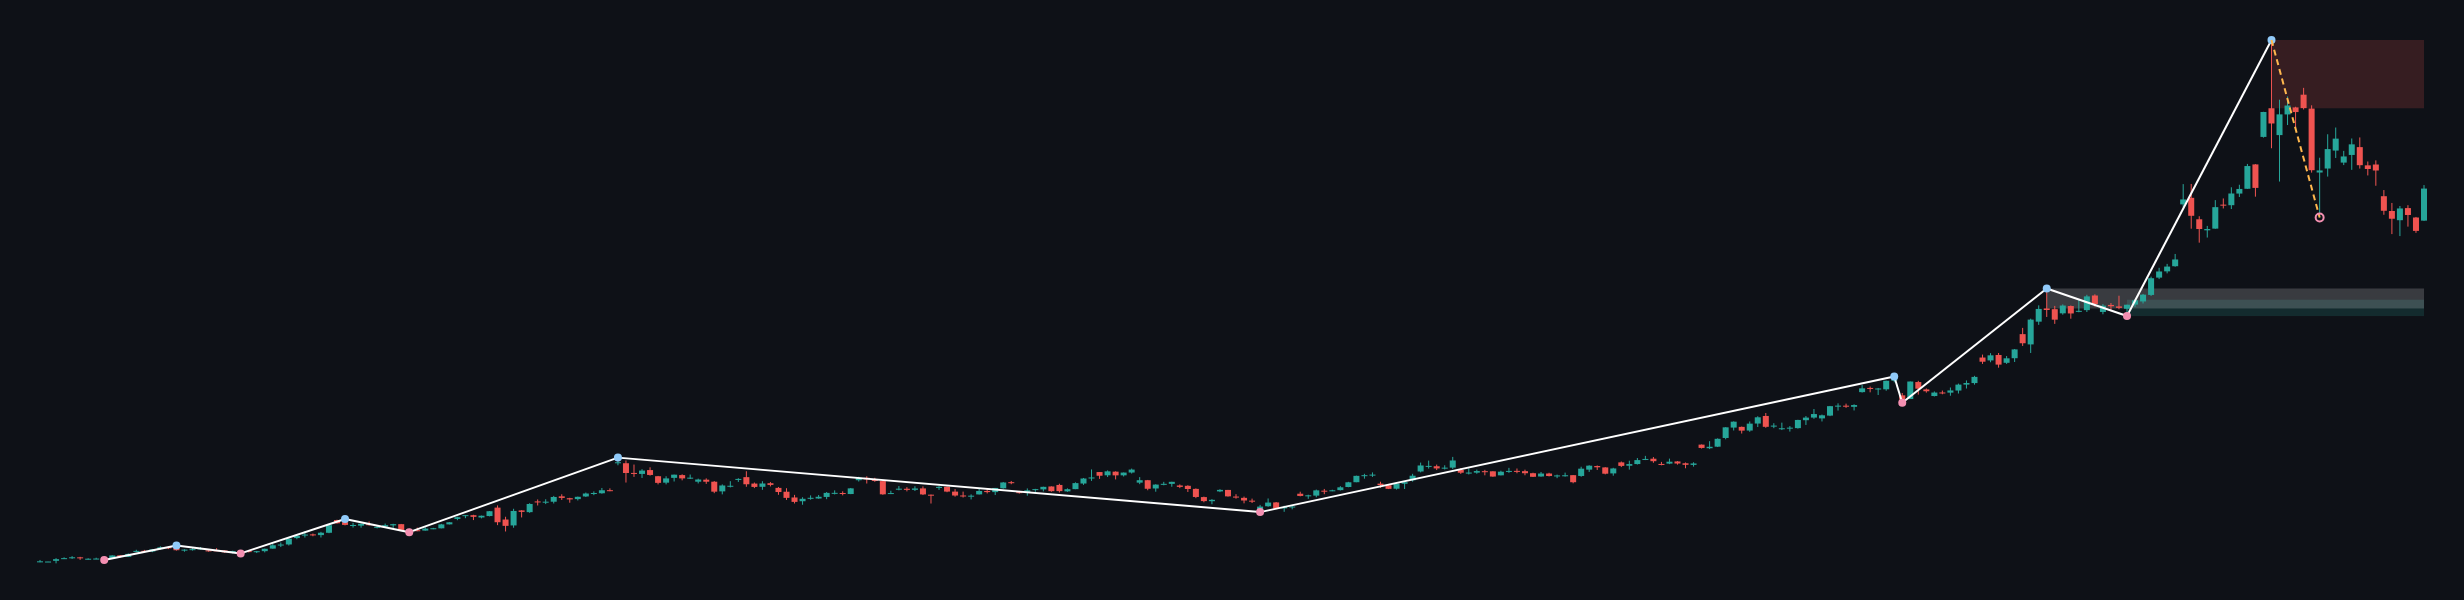
The weekly trend is up and firm, but the sub-trend is down. No weekly structure event is reported. The most recent confirmed weekly swing is a high at 5595.362, so the larger advance remains intact in the supplied framework, although the retreat from that swing has introduced counter-trend pressure.
Weekly support is identified at 3268.058 – 3405.143. A separate broken-retest support zone is marked at 3331.873 – 3500.057. Above the current weekly close, the major resistance zone is 5019.871 – 5595.362. The weekly ATR is 274.171, indicating that the broader frame allows for materially wider movement than the daily structure.
The supplied report does not provide exact weekly moving-average values or their spacing, so their numerical position and any crossover are not determinable from the report. The higher timeframe therefore permits further upside, but the downward sub-trend means that rallies can still meet distribution before the major resistance zone.
Main-frame structure
The daily main trend is down and shaky, while the sub-trend is up. This does not yet represent a clean alignment with the weekly trend; it can be read either as an upward recovery within a damaged daily structure or as an early reversal attempt.
The key daily structure event is a change of character at 4382.441. The associated resistance zone spans 4331.294 – 4382.441. With the daily close at 4414.301, the market is currently above that zone, but confirmation depends on whether the former ceiling acts as support during any retest.
The latest completed Dow leg runs from 3942.138 to 4382.441. Its Fibonacci levels are 0 at 3942.138, 0.236 at 4046.050, 0.382 at 4110.334, 0.5 at 4162.290, 0.618 at 4214.245, 0.786 at 4288.216, and 1 at 4382.441. The current retracement ratio is 1.000, placing price at the completed-leg extreme rather than within a conventional pullback band.
The daily ATR is 83.412. Exact moving-average values, volume readings and momentum readings are not included in the deterministic report, so their numerical confirmation or divergence is not determinable.
Reading the latest daily price action
The chart shows a recovery from the area surrounding the confirmed swing low at 3942.138, followed by consolidation and a renewed push above the former daily resistance zone. The latest candles have a constructive appearance, but the move is approaching the upper edge of the visible daily structure rather than emerging from an untested base.
The exact candle classification, wick proportions and close location within the latest candle are not determinable from the deterministic report. What can be stated is that the latest daily close at 4414.301 is above 4382.441. That favors buyers on a structural basis, while a return into 4331.294 – 4382.441 would test whether the change of character represents acceptance or a failed break.
Key levels and scenarios
- Primary bullish scenario: price remains accepted above 4382.441, with the former resistance zone at 4331.294 – 4382.441 holding as a retest area. The broader upside reference is the weekly resistance zone at 5019.871 – 5595.362. This scenario is invalidated by a sustained return below 4331.294. It has the stronger qualitative probability while price remains above the daily zone.
- Secondary bearish scenario: price fails above the daily resistance area and closes back below 4331.294. Such a move would weaken the change-of-character signal and reopen the path toward daily support at 3942.138 – 4005.629. The scenario is invalidated by renewed acceptance above 4382.441.
- Risk or surprise scenario: price remains trapped between the daily resistance area and the lower support region, producing a range rather than directional follow-through. A break below 4005.629 would expose the lower boundary at 3942.138; a recovery above 4382.441 would instead restore the bullish structural reading. This scenario is invalidated when price establishes itself beyond the relevant boundary.
The daily bias leans cautiously bullish while 4382.441 holds, but the expected path remains conditional because the daily main trend is still down and the weekly sub-trend is also down.
Levels worth observing
- Near resistance: 4331.294 – 4382.441, particularly as a possible broken-retest zone.
- Far resistance: 5019.871 – 5595.362.
- Near support: 4023.812 – 4065.518, the reported broken-retest resistance area that may be relevant if weakness extends.
- Far support: 3942.138 – 4005.629.
- Weekly support references: 3268.058 – 3405.143 and 3331.873 – 3500.057.
The cleanest confirmation would be continued daily acceptance above 4382.441 followed by a successful retest of the surrounding zone. Conversely, a close below 4331.294 would favor the bearish interpretation. Readers should also account for false breaks and liquidity sweeps around widely watched levels; the supplied report does not identify a scheduled event window.
No news, calendar timing, currency-index data or yield data are included in the deterministic report. Those factors may affect gold volatility, but their present influence is not determinable here. General risk controls remain important: avoid treating a single candle as confirmation, keep exposure proportionate to the volatility implied by the daily ATR of 83.412, and be cautious around unreported macroeconomic announcements.
Summary
- The weekly trend is up and firm, although its sub-trend is down.
- The daily trend is down and shaky, with an upward sub-trend and a reported change of character at 4382.441.
- The daily close at 4414.301 is above the resistance zone at 4331.294 – 4382.441.
- Holding above 4382.441 supports a continuation scenario toward the broader weekly resistance area.
- A failure below 4331.294 would weaken the recovery and refocus attention on 3942.138 – 4005.629.
The single most important issue today is whether 4382.441 becomes confirmed support or whether price falls back through 4331.294.
This article is technical analysis and reference information only, not investment advice. Markets carry risk, and readers are responsible for their own decisions.