
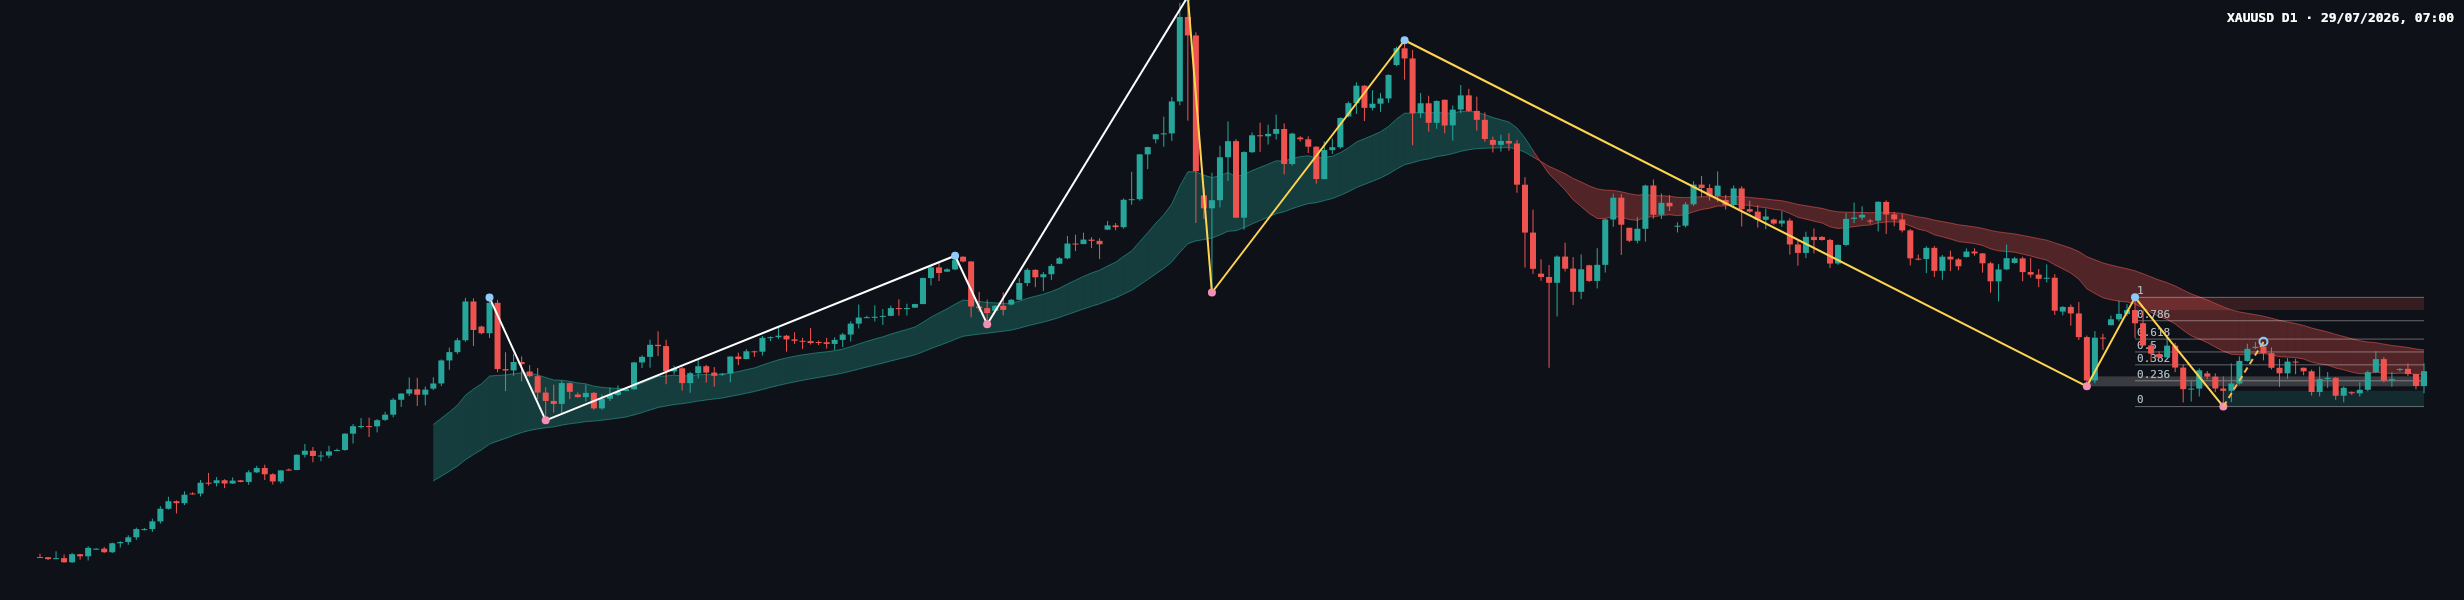
XAU/USD presents a mixed multi-timeframe picture. The weekly chart retains a firm upward trend, while the daily chart remains in a firm downtrend with an upward sub-trend. The latest daily close at 4084.790 places price above the daily broken-retest zone at 4023.812–4063.728, but the market is still below the next important Fibonacci reference at 4110.334.
Higher-timeframe context
The weekly structure continues to favor the buyers because the main trend is up and no weekly structure event has been recorded. However, the weekly sub-trend is down, showing that the latest advance has been followed by a corrective phase rather than uninterrupted directional movement. The most recent confirmed weekly swing is the high at 5595.362.
The weekly last closed price is 4052.808. This is well below the weekly resistance zone at 5019.871–5595.362, leaving substantial room before the broader supply area is reached. Below price, the weekly support zones are 2536.779–2673.227 and the broken-retest area at 2653.651–2790.099. The weekly ATR is 272.896, indicating that the higher-timeframe reference range is materially wider than the current daily decision area.
The weekly chart does not provide a clearly determinable numerical EMA position or weekly Fibonacci interaction in the deterministic report. The key higher-timeframe message is therefore structural: the firm weekly uptrend permits renewed upside, but the down sub-trend means that rallies can still develop within a broader correction. A sustained move toward the weekly resistance zone would require acceptance above the daily resistance structure first.
Main-frame structure
On the daily timeframe, the main trend is down and firm, while the sub-trend is up. This creates a clear conflict with the weekly trend. At present, the daily rise is better classified as a recovery inside the larger daily decline; it would become a more meaningful reversal signal only if price can reclaim the upper daily resistance area and establish new bullish structure.
The daily close at 4084.790 is above the broken-retest resistance zone at 4023.812–4063.728. That area is now important because a successful hold above it would show that former resistance is beginning to act as support. A return below the zone would weaken the recovery and put the main daily support zone at 3942.138–4005.629 back into focus.
The daily chart shows price interacting with the latest completed Dow leg through the Fibonacci area between 4046.050 and 4110.334. The current retracement ratio is 0.324, placing the market between the 0.236 and 0.382 Fibonacci levels. The most recent confirmed daily swing is the low at 3942.138, and no daily structure event has been recorded.
The daily EMA information is visible as a declining overhead envelope, but exact EMA values are not determinable from the report. Price appears to be recovering into that overhead area rather than trading in a clearly established daily uptrend. The daily ATR is 79.832, which provides context for potentially active movement around the nearby Fibonacci and broken-retest references.
Recent closing-candle reading
The latest group of daily candles is characterised by relatively narrow, mixed bodies and repeated hesitation around the lower consolidation area. The candles do not show a clean, decisive expansion away from the broken-retest zone. Their positioning suggests that buyers have defended the area around 4023.812–4063.728, while sellers remain active above the recovery zone.
Relative to the Fibonacci references, the latest close at 4084.790 is above 4046.050 but below 4110.334. This places the close in an area where the recovery is constructive but not yet fully confirmed. The candle sequence therefore reads as a warning against assuming continuation without acceptance above the next Fibonacci barrier. A close back below 4023.812 would instead suggest rejection of the recovery and renewed seller control.
Volume and a separate momentum indicator are not clearly available in the provided chart data, so they cannot be used as confirmation. Price structure remains the primary evidence.
Key levels
| Reference | Level or zone | Interpretation |
|---|---|---|
| Daily recovery reference | 4046.050 | Fibonacci level beneath the latest daily close |
| Broken-retest area | 4023.812–4063.728 | Support while price remains accepted above the zone |
| Daily Fibonacci resistance | 4110.334 | Next confirmation threshold for the recovery |
| Higher daily resistance | 4331.294–4382.441 | Major overhead supply zone |
| Daily support | 3942.138–4005.629 | Main downside demand area |
| Weekly resistance | 5019.871–5595.362 | Broader supply area above the daily structure |
Conditional scenarios
Primary scenario: recovery extends
If daily price accepts above 4110.334, the upward sub-trend would gain technical support and the recovery could extend toward the daily resistance zone at 4331.294–4382.441. The scenario would be weakened if price falls back below 4023.812, because that would indicate that the broken-retest area has failed to hold as support. Relative likelihood is constructive, but confirmation remains absent until the Fibonacci barrier is cleared.
Secondary scenario: range holds
If price remains between the broken-retest area at 4023.812–4063.728 and the Fibonacci reference at 4110.334, the market may continue consolidating. This would preserve the daily upward sub-trend without resolving the larger daily downtrend. A decisive close below 4023.812 would invalidate the neutral range interpretation and shift attention toward 3942.138–4005.629.
Risk scenario: daily recovery fails
If sellers push price below 4023.812 and the move develops toward the daily support zone at 3942.138–4005.629, the firm daily downtrend would regain prominence. A return above 4110.334 would invalidate this bearish continuation view. A deeper reversal below the daily support zone would also bring the weekly support references at 2536.779–2673.227 and 2653.651–2790.099 into the broader discussion, although those zones are distant from the current daily structure.
Session considerations
- Resistance: monitor 4110.334 first, followed by 4331.294–4382.441 and the broader weekly zone at 5019.871–5595.362.
- Support: monitor 4023.812–4063.728, then 3942.138–4005.629.
- Confirmation: bullish confirmation would require acceptance above 4110.334; bearish confirmation would require sustained trade below 4023.812.
- Traps: false breaks around the broken-retest zone and short-lived liquidity sweeps can produce misleading signals before the daily close.
- Fundamentals: traders should monitor the DXY, United States Treasury yields, the economic calendar, central-bank communication and geopolitical headlines. No specific scheduled event time is provided in the deterministic report.
- Risk principles: market conditions can change quickly around macroeconomic releases. General risk controls include avoiding excessive exposure, allowing for volatility and not assuming that a zone will hold merely because it held previously.
Asian trading may continue the current consolidation, while European and United States sessions can provide the larger test of 4110.334 or 4023.812. The relevant distinction is not the session label itself, but whether price produces a sustained close beyond one of those boundaries.
Summary
- The weekly main trend is firmly up, although the weekly sub-trend is down.
- The daily main trend remains firmly down, while the daily sub-trend is up.
- The daily close at 4084.790 is above the broken-retest zone at 4023.812–4063.728.
- A move above 4110.334 would strengthen the recovery case toward 4331.294–4382.441.
- A move below 4023.812 would refocus attention on 3942.138–4005.629.
The single most important consideration is whether price can establish acceptance above 4110.334 without losing the support role of 4023.812–4063.728.
#XAUUSD #GoldAnalysis #PriceAction #ForexMarkets #TechnicalAnalysis
Meta description: XAU/USD holds above 4023.812–4063.728 as weekly and daily trends diverge. Key confirmation levels are 4110.334 and 3942.138.
This article is technical analysis and reference information only, not investment advice. Markets carry risk, and readers are responsible for their own decisions.