
GBPUSD closed at 1.35335 on the D1 timeframe, placing price inside the main resistance zone at 1.35286–1.35580. The daily structure remains sideways, while the weekly framework is still firmly down with an upward sub-trend. The immediate question is whether buyers can establish acceptance above 1.35580 or whether sellers will defend the zone and drive price back toward the nearby broken-retest area.
Higher-timeframe context
The W1 main trend is down and remains firm, while the sub-trend is up. The most recent confirmed weekly swing is a low at 1.03535, and the report identifies no weekly structure event. This means the higher-timeframe trend has not received a confirmed structural reversal signal.
Price is currently at 1.35335, above the broken-retest resistance zone at 1.31602–1.32452 and below the larger resistance zone at 1.36637–1.37487. The weekly support zone is 1.03535–1.08025. These zones frame the broader market: the upward sub-trend has lifted price away from the former resistance area, but the firm weekly downtrend still places the higher resistance zone above the market in focus.
Weekly ATR is 0.01699. No weekly Fibonacci levels are supplied in the report, so interaction with a weekly Fibonacci level is not determinable from the available data. Likewise, the weekly EMA20 and EMA50 positions, slopes, spacing, and any crossover are not determinable from the report.
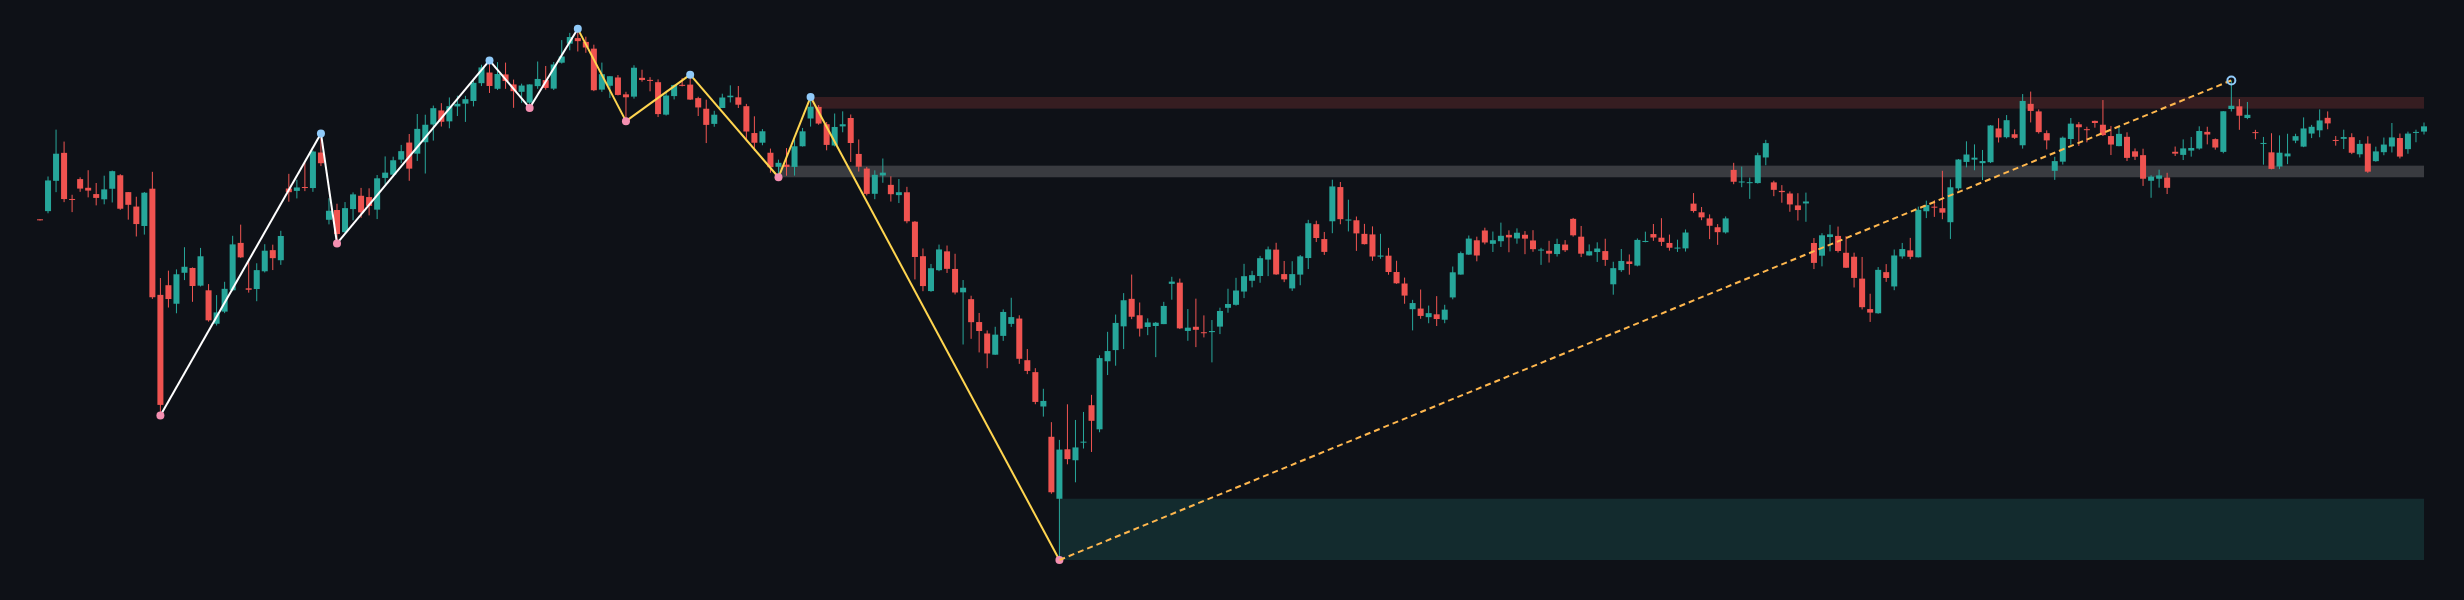
The weekly picture permits continued upside toward 1.36637–1.37487 if price can achieve acceptance above 1.35580, but it continues to favor caution because the primary W1 trend is down and no structure event has been recorded.
Main-frame structure
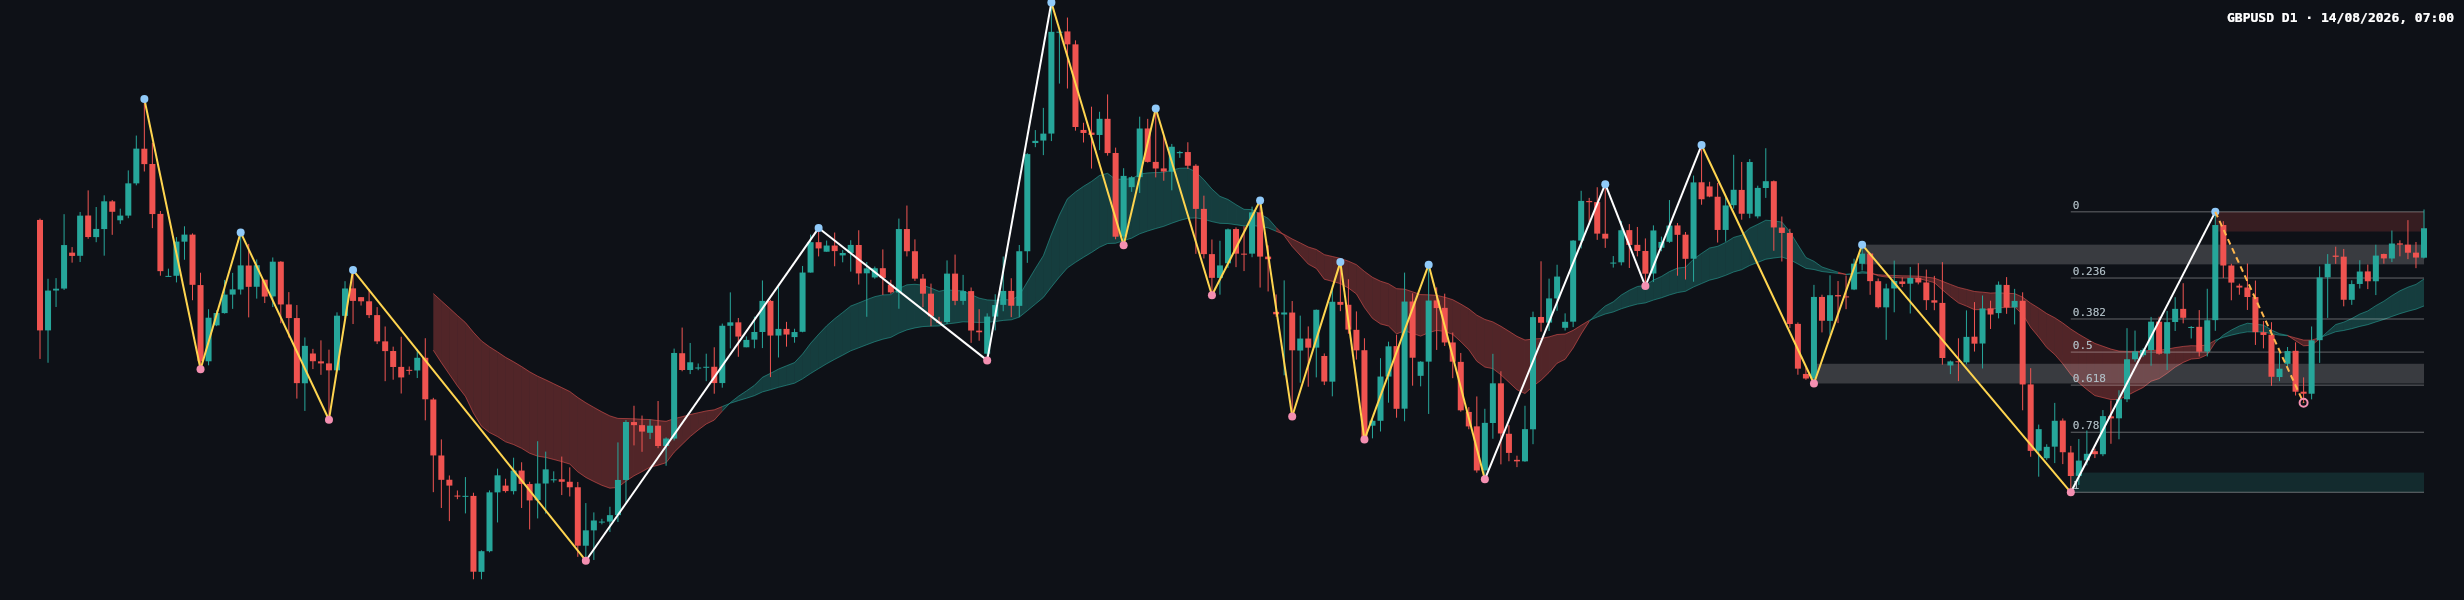
On the D1 frame, both the main trend and sub-trend are sideways. This is not aligned with the weekly main trend, which is down, although the weekly sub-trend is up. The result is a mixed-timeframe environment: the daily chart is consolidating while the higher timeframe is undergoing an upward counter-move inside a broader bearish framework.
The most recent confirmed daily swing is a high at 1.35580. No daily structure event is recorded. The current retracement ratio is 0.059, showing that price is positioned near the origin of the latest completed Dow leg rather than deep within its retracement range.
The supplied daily Fibonacci levels are: 0: 1.35580, 0.236: 1.34592, 0.382: 1.33981, 0.5: 1.33487, 0.618: 1.32994, 0.786: 1.32291, and 1: 1.31395. With price at 1.35335, the market is close to the 0: 1.35580 boundary and above the 0.236: 1.34592 level.
The daily ATR is 0.00587. EMA20 and EMA50 details are not listed in the deterministic report, so their exact position, slope, spacing, and crossover status are not determinable from the permitted data. Volume and momentum readings are also not supplied and should not be treated as confirmation.
Recent candle and price action
The deterministic report provides the latest closing price and confirmed swing information, but it does not provide the individual open, high, low, close, wick, or range measurements for the last several candles. Therefore, the precise candle type of the latest session, its close location within the candle, and a candle-by-candle analysis of the last three to five sessions are not determinable from the report.
What is determinable is the location of the close: 1.35335 is inside the daily resistance zone at 1.35286–1.35580 and below the latest confirmed swing high at 1.35580. That positioning describes compression beneath a decision area, but it does not by itself establish buyer control, seller rejection, absorption, or a reversal candle.
Key levels
- 1.35286–1.35580: current daily resistance zone and the immediate decision area.
- 1.35580: latest confirmed daily swing high and the upper boundary of the current resistance zone.
- 1.34796–1.35090: daily broken-retest support zone below the current close.
- 1.34592: daily Fibonacci 0.236 level.
- 1.33019–1.33313: daily broken-retest resistance zone, now lower in the structure.
- 1.31395–1.31689: daily support zone, with 1.31395 also marking the supplied Fibonacci endpoint.
- 1.36637–1.37487: major W1 resistance zone above the daily market.
- 1.31602–1.32452: W1 broken-retest resistance zone.
- 1.03535–1.08025: W1 support zone and the area containing the most recent confirmed weekly swing low at 1.03535.
Conditional scenarios
Primary scenario: resistance holds and the range remains active
If price remains within 1.35286–1.35580 without a confirmed daily structure event, the sideways D1 interpretation remains valid. A move back below 1.35286 would keep rejection risk active, with the first lower zone of interest at 1.34796–1.35090. Invalidation of this range-bound bearish response would be sustained acceptance above 1.35580. This is the highest-priority scenario by structure, but a numeric probability is not provided in the report.
Secondary scenario: daily breakout toward weekly resistance
If a daily close establishes above 1.35580, the current resistance zone would be challenged from above and the next higher-timeframe area to monitor would be 1.36637–1.37487. The breakout interpretation would be invalidated if price returns below 1.35286 and fails to hold above the former resistance area. The weekly downtrend means that such a move would still require confirmation rather than being treated as a confirmed trend reversal. No numeric probability is available.
Risk scenario: deeper retracement
If price loses the daily support zone at 1.34796–1.35090, attention would shift toward 1.34592, followed by the broader support area at 1.31395–1.31689 if selling pressure persists. The deeper bearish scenario would be weakened by a recovery above 1.35090, while a return above 1.35580 would restore the breakout question. This scenario also has no report-supplied probability.
Session focus
The cleanest confirmation would come from how price behaves around 1.35286–1.35580: acceptance above 1.35580 would support the higher resistance scenario, while rejection back below 1.35286 would preserve the range and expose 1.34796–1.35090. Traders should also monitor false breaks and liquidity sweeps around the latest swing high at 1.35580.
The available report contains no economic-calendar schedule, news context, DXY information, yield data, or session-specific statistics. Those factors cannot be assessed from the permitted data. General risk principles remain relevant: avoid treating an unconfirmed break as established structure, account for the daily ATR of 0.00587, and reassess exposure when price reaches either boundary of the active zones.
Summary
- GBPUSD closed at 1.35335 inside the D1 resistance zone at 1.35286–1.35580.
- The W1 main trend is firmly down, although the sub-trend is up.
- The D1 main trend and sub-trend are both sideways, with no recorded structure event.
- A sustained move above 1.35580 would place 1.36637–1.37487 on watch.
- A move below 1.34796–1.35090 would increase the risk of a deeper retracement toward 1.34592.
The single most important thing today is whether price is accepted above 1.35580 or rejected back below 1.35286.
Hashtags: #GBPUSD #ForexAnalysis #PriceAction #DowTheory #TechnicalAnalysis
Meta description: GBPUSD trades at 1.35335 inside daily resistance, with a weekly downtrend and conditional breakout or retracement scenarios.
This article is technical analysis and reference information only, not investment advice. Markets carry risk, and readers are responsible for their own decisions.