
GBPUSD closed at 1.34268 with the daily market still classified as sideways and its sub-trend pointing down. Price is below the daily resistance zone at 1.35216–1.35580 and has also moved beneath the broken-retest area at 1.34726–1.35090. The most notable feature is the tension between a broader weekly downtrend and a daily range that has not yet produced a confirmed structure event.
| Metric | Reading |
|---|---|
| Most recent close | 1.34268 |
| Weekly trend | Down, firm; sub-trend up |
| Daily trend | Sideways, firm; sub-trend down |
| Weekly ATR | 0.01846 |
| Daily ATR | 0.00728 |
| Nearest resistance | 1.35216–1.35580 |
| Nearest support | 1.31395–1.31759 |
| Current Fibonacci retracement | 0.314, between 0.236 at 1.34592 and 0.382 at 1.33981 |
Higher-timeframe context
The weekly main trend is down and described as firm, although the sub-trend is up. The most recent confirmed weekly swing is a low at 1.09232, and the report records no current structure event. This combination permits a recovery within the larger decline, but it does not yet establish a confirmed weekly reversal.
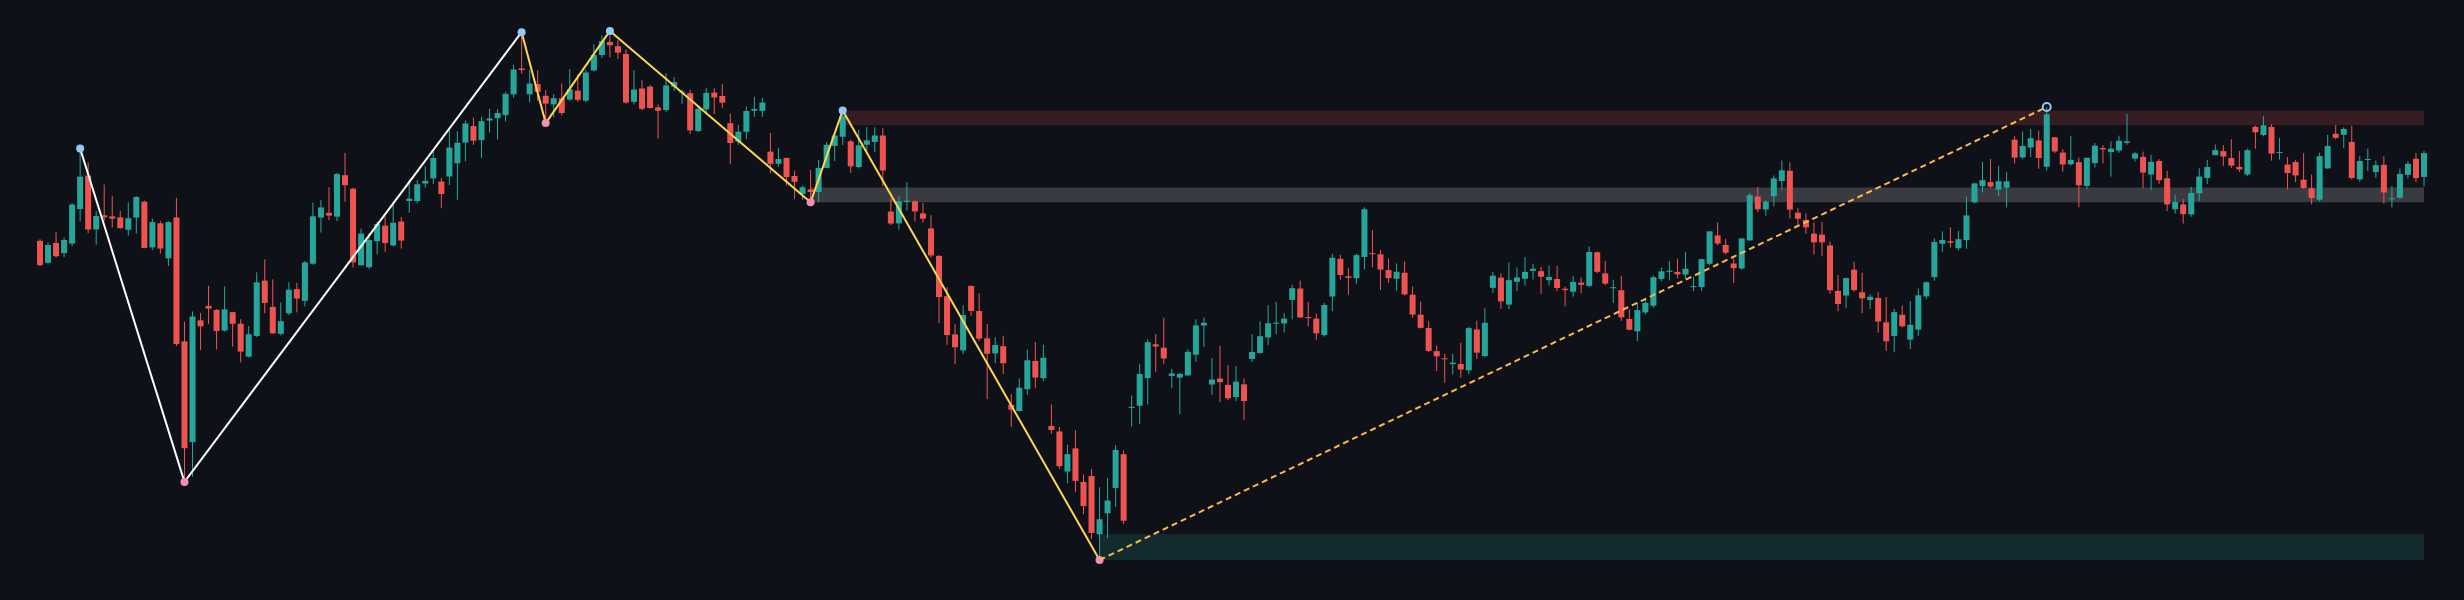
Weekly resistance is concentrated at 1.36564–1.37487. A sustained move into that area would place the recent recovery against a significant higher-timeframe supply zone. Below the market, the major weekly support zone is 1.09232–1.10850. The former weekly resistance zone at 1.31717–1.32640 is marked as broken-retest support, making it an important reference if the daily decline extends.
The weekly ATR is 0.01846, indicating a wider higher-timeframe movement envelope than the daily ATR of 0.00728. Numeric weekly Fibonacci values are not supplied in the report, so the exact interaction between weekly Fibonacci and current price is not determinable from the available data. The higher timeframe therefore favors caution around rallies, while leaving room for the weekly sub-trend to continue upward unless support fails.
Main-frame structure
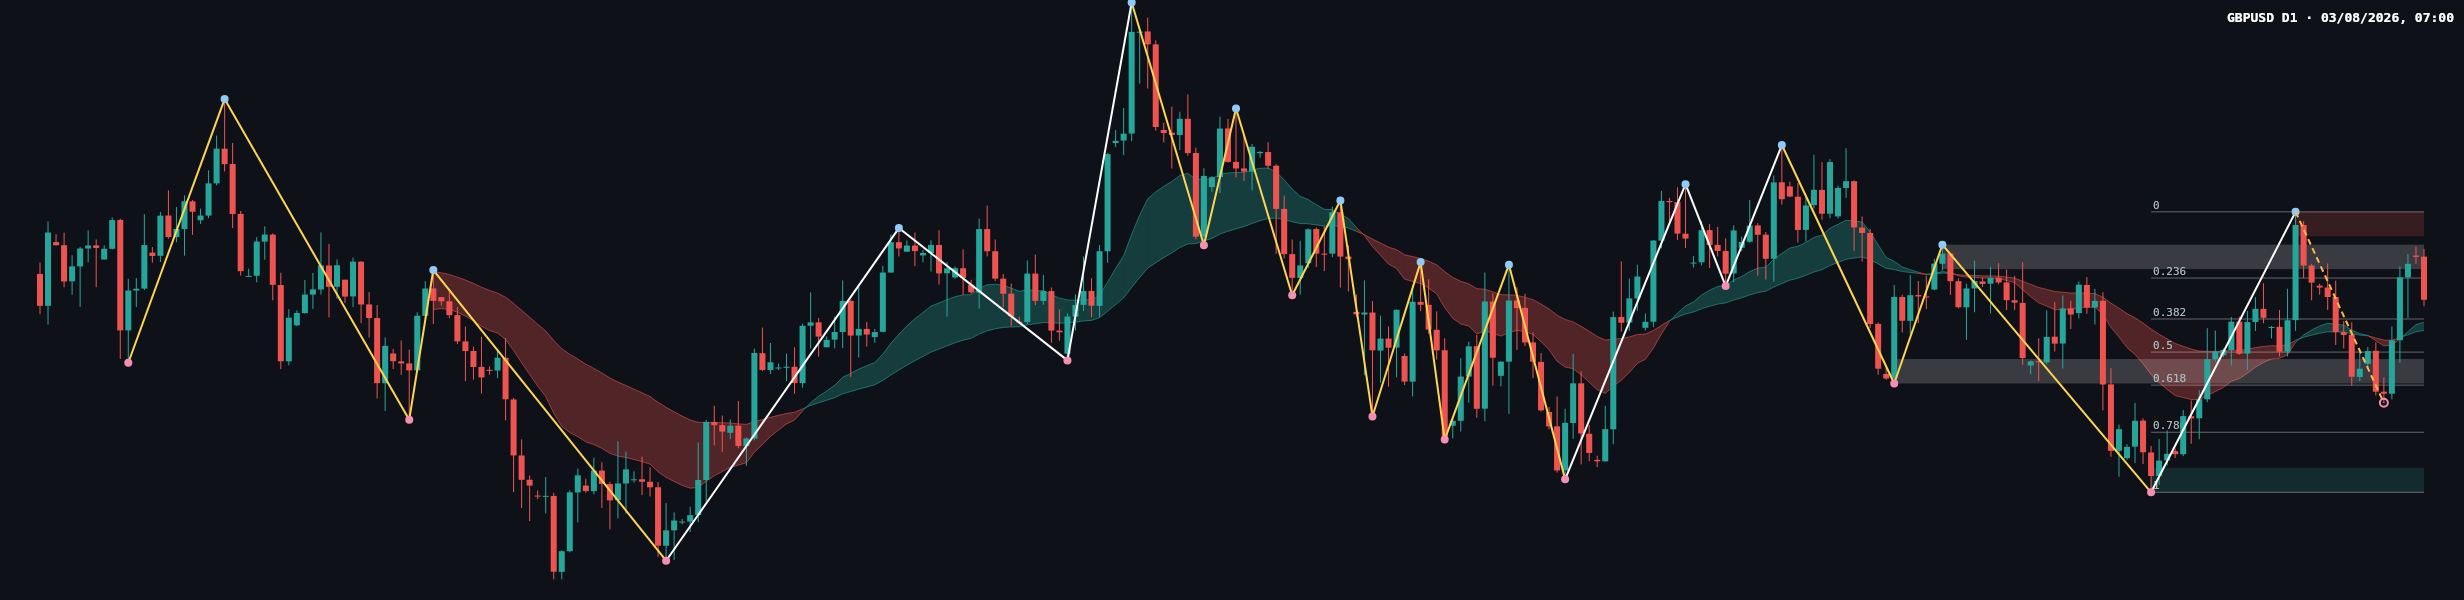
The daily main trend is sideways and firm, while the sub-trend is down. The latest confirmed daily swing high is 1.35580, and no structure event is recorded. Price is currently below the broken-retest resistance zone at 1.34726–1.35090, which keeps sellers relevant, but the absence of a confirmed break means the range has not resolved decisively.
The daily Fibonacci leg runs from 0 at 1.35580 to 1 at 1.31395. The listed levels are 0.236 at 1.34592, 0.382 at 1.33981, 0.5 at 1.33487, 0.618 at 1.32994, and 0.786 at 1.32291. The current retracement ratio is 0.314, placing price between 1.34592 and 1.33981. A move below 1.33981 would expose deeper retracement references, while recovery above 1.34592 would show that the latest decline is losing immediate control.
The report does not provide numeric moving-average values, so the precise distance between the daily averages, their slopes, and any crossover are not determinable from the deterministic data. The chart does show a moving-average ribbon, but exact readings should not be inferred beyond the stated trend and structure data.
Key levels and recent price action
The central daily resistance area is 1.35216–1.35580, with 1.35580 also marking the latest confirmed swing high. The first overhead reference is the broken-retest zone at 1.34726–1.35090. Below current price, 1.33981 is the listed 0.382 Fibonacci level, followed by 1.33487 at 0.5 and 1.32994 at 0.618. The daily support zone at 1.31395–1.31759 is the lower structural reference.
The most recent candle should be interpreted in relation to these levels rather than in isolation. The report does not classify its body or wick structure, and the candle image does not provide deterministic numerical measurements for its range. What can be established is that the close at 1.34268 sits below 1.34592 and above 1.33981, so the latest close is positioned inside the current Fibonacci band. That placement suggests neither a confirmed bullish recovery nor a completed bearish breakdown.
Conditional scenarios
Primary scenario: continued range pressure
If price remains below 1.34726–1.35090 and continues to hold above 1.33981, the most likely interpretation is continued daily consolidation between broken-retest resistance and the nearby Fibonacci support reference. The scenario is invalidated by a sustained move above 1.35580 or a decisive break below 1.33981. No numerical probability is assigned because the deterministic report provides no probability model.
Secondary scenario: bullish recovery
If daily price reclaims 1.34726–1.35090 and then clears 1.35216–1.35580, the range could resolve upward toward the weekly resistance zone at 1.36564–1.37487. The bullish interpretation would be weakened if price falls back below 1.34726 after the reclaim, and invalidated as a breakout scenario by a failure below 1.33981.
Risk scenario: deeper bearish retracement
If price breaks below 1.33981, sellers could steer the daily leg toward 1.33487, 1.32994, and the daily support zone at 1.31395–1.31759. A recovery above 1.34726–1.35090 would undermine the immediate bearish case, while a move above 1.35580 would invalidate the broader downside setup on this frame.
What to monitor
- Watch whether price accepts or rejects the broken-retest resistance at 1.34726–1.35090.
- Monitor 1.34592 and 1.33981 as the nearest Fibonacci references.
- A close above 1.35580 would provide stronger evidence of an upside range resolution.
- A close below 1.33981 would shift attention toward 1.33487, 1.32994, and 1.31395–1.31759.
- Because no news context is supplied, traders should independently check the economic calendar and monitor volatility around major United States and United Kingdom releases.
Overall, GBPUSD is balanced inside a daily range but carries a bearish short-term tilt while below 1.34726–1.35090. The weekly downtrend argues against treating a rally as a confirmed reversal until price can overcome 1.35580 and challenge the higher-timeframe resistance at 1.36564–1.37487.
GBPUSD technical analysis for reference only; it is not investment advice. Markets carry risk, and readers are responsible for their own decisions.
#GBPUSD #ForexAnalysis #PriceAction #DowTheory #TechnicalAnalysis
GBPUSD daily analysis: a sideways market with a bearish sub-trend, key Fibonacci references, and conditional bullish and bearish scenarios.