
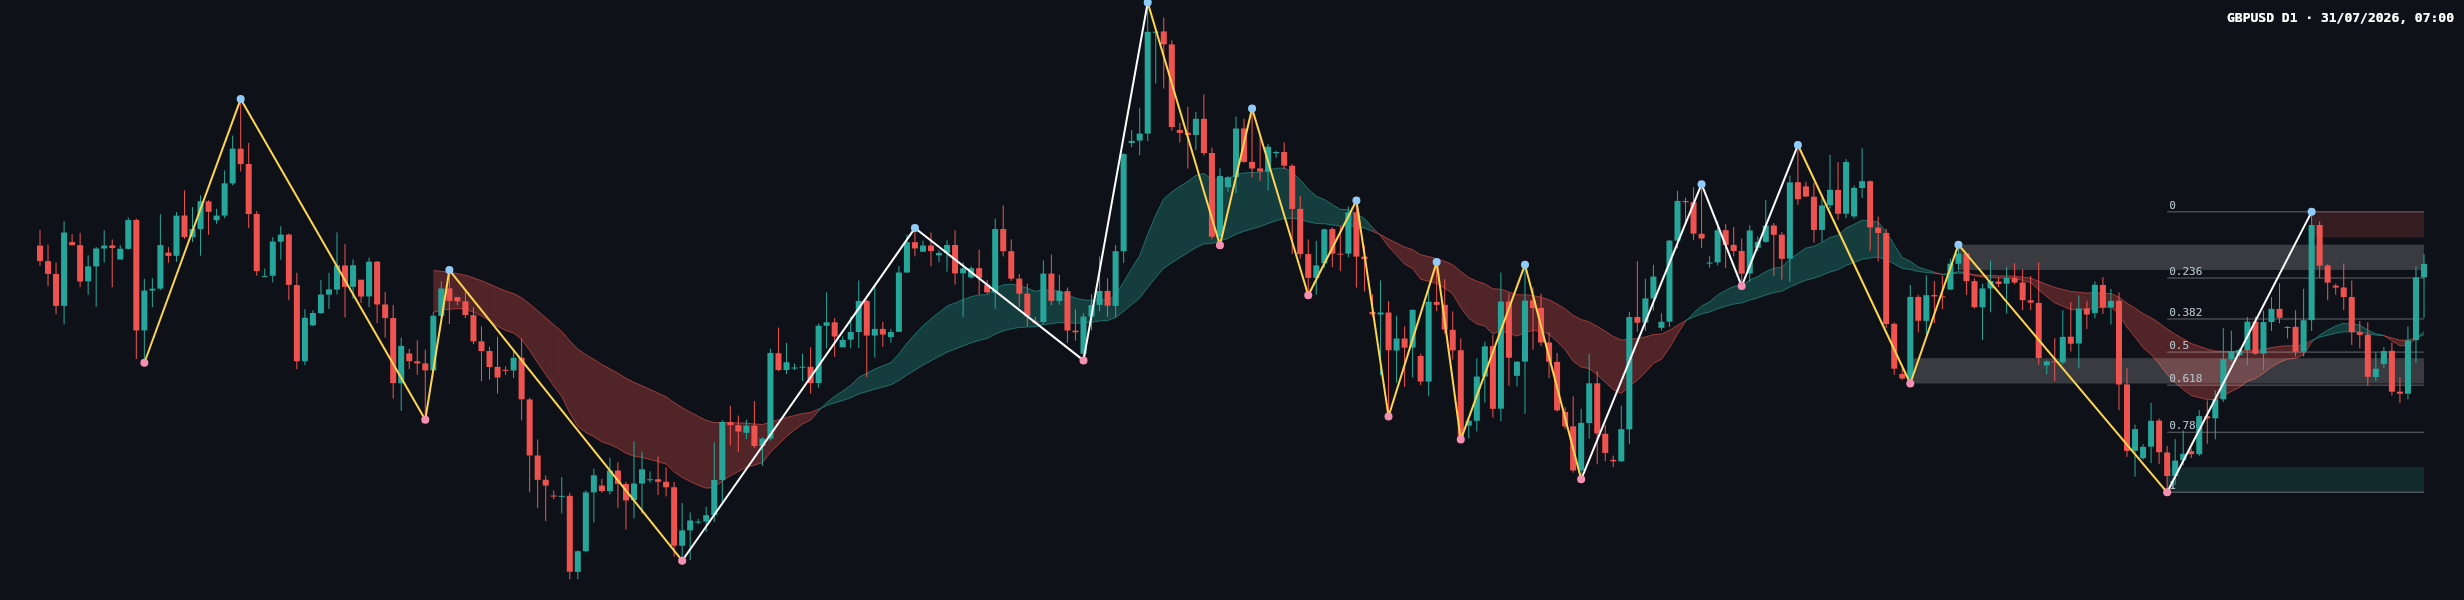
GBPUSD closed at 1.34804, with the higher-timeframe trend still firmly upward while the main-frame structure remains sideways and its sub-trend is down. Price is currently testing the daily broken-retest support zone at 1.34713–1.35090, leaving the market balanced between a recovery toward 1.35203–1.35580 and renewed weakness toward lower Fibonacci and support areas.
| Metric | Reading |
|---|---|
| Most recent close | 1.34804 |
| Weekly trend | Up, firm; sub-trend down |
| Daily trend | Sideways, firm; sub-trend down |
| Nearest resistance | 1.35203–1.35580 |
| Nearest support | 1.34713–1.35090 |
| Active Fibonacci reading | Current retracement ratio 0.185; nearby level 0.236 at 1.34592 |
| Daily ATR | 0.00754 |
Higher-timeframe context
The weekly framework remains constructive: the main trend is up and firm, although the sub-trend is down. No weekly structure event is recorded, so the recent weakness has not yet produced a confirmed structural reversal. The most recent confirmed weekly swing is a high at 1.38704.
Price at 1.34804 is below the weekly broken-retest support zone at 1.36977–1.37884. That area therefore remains an important overhead reference. Above it, the wider weekly resistance zone is 1.37797–1.38704. The principal weekly demand area below is 1.30097–1.31346. Weekly ATR is 0.01815, indicating that the broader frame allows substantial movement between these zones.
The weekly chart does not provide a deterministic Fibonacci reading in the report, so interaction with a weekly Fibonacci level is not determinable from the supplied data.
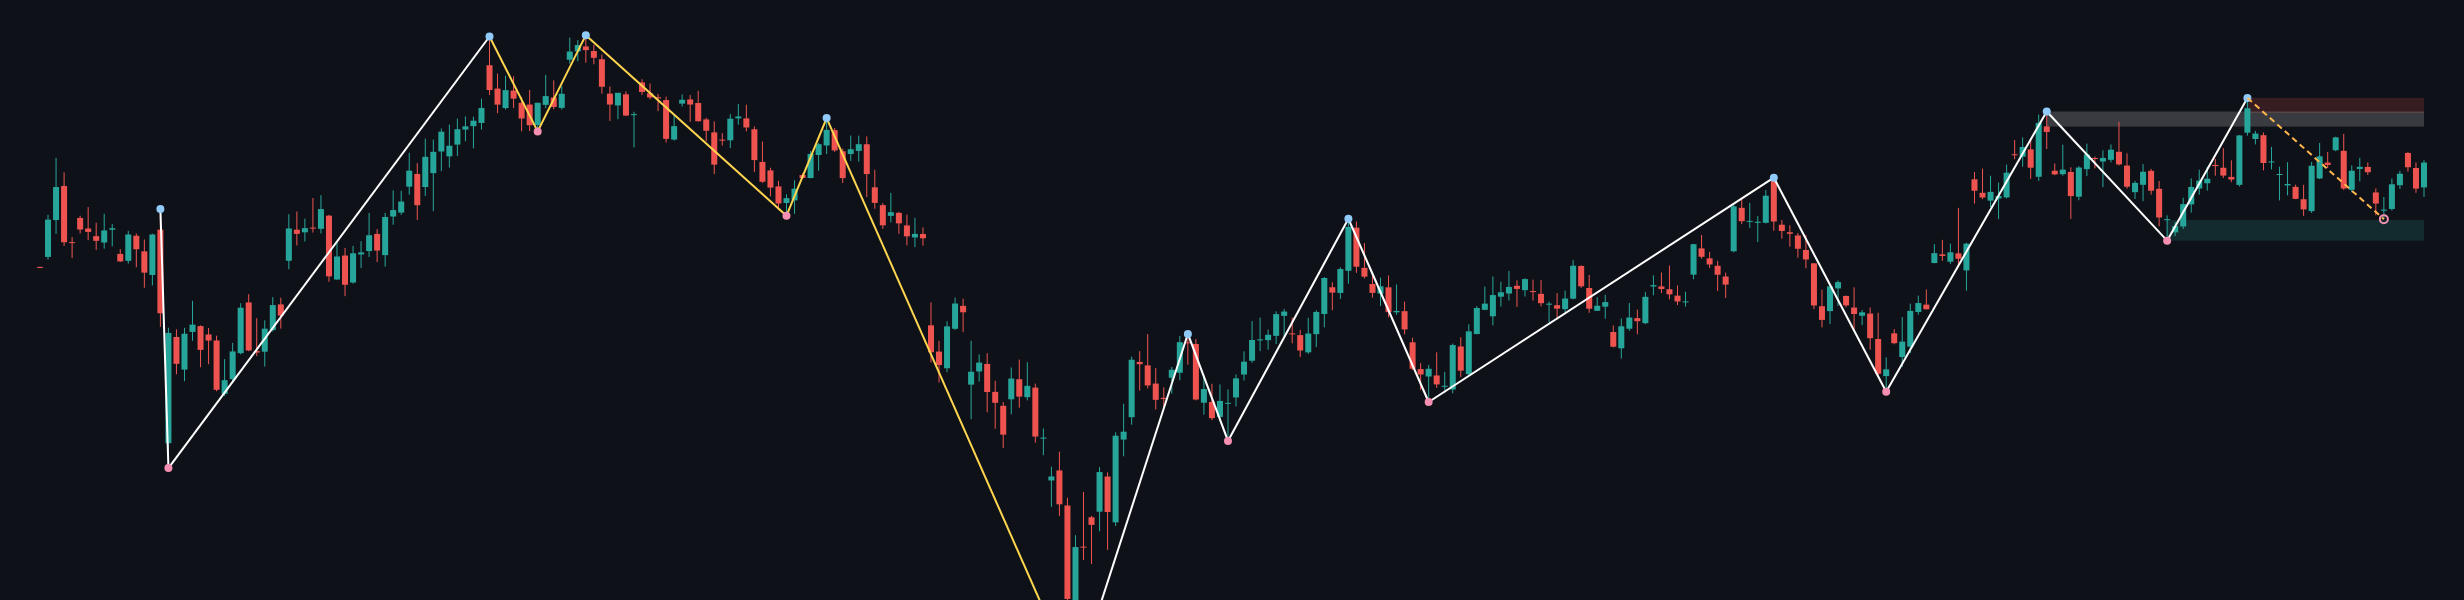
Weekly conclusion: The higher timeframe still permits a bullish continuation, but price would need to recover the broken-retest area at 1.36977–1.37884 to improve that interpretation. Continued trade below it leaves the weekly sub-trend vulnerable to further consolidation or decline toward 1.30097–1.31346.
Main-frame structure
The daily main trend is sideways and firm, while the sub-trend is down. This is not fully aligned with the weekly uptrend. The daily weakness can therefore be treated as a pullback or consolidation within the larger bullish framework, but a sustained failure of lower supports would increase the risk that it is developing into an early reversal signal.
The latest confirmed daily swing high is 1.35580, and no structure event is recorded. This means there is no confirmed daily break of structure or change of character in the deterministic report. The visible moving-average envelope is mixed rather than decisively directional, and exact moving-average values, spacing and crossover status are not determinable from the report.
The latest completed daily Dow leg has Fibonacci levels at 0: 1.35580, 0.236: 1.34592, 0.382: 1.33981, 0.5: 1.33487, 0.618: 1.32994, 0.786: 1.32291, and 1: 1.31395. The current retracement ratio is 0.185, placing the market close to the 0.236 reference at 1.34592. The nearby support zone at 1.34713–1.35090 is consequently the first test of whether buyers can stabilize the decline.
Recent price action and closing candle
The latest visible candle is bullish, with the close positioned near the upper part of its daily range after a test of the lower area. Its recovery is constructive, but it has not yet cleared the resistance zone at 1.35203–1.35580. The candle therefore shows responsive buying rather than a confirmed directional break.
Relative to the preceding sequence, the rebound suggests that sellers have met demand around 1.34713–1.35090. However, the daily sub-trend remains down and the close at 1.34804 is still inside that broken-retest zone. The buyer-versus-seller balance will be clearer if subsequent candles either hold the zone and reclaim 1.35203–1.35580, or close below it and extend toward 1.34592.
Volume and momentum confirmation are not included in the deterministic report, so confirmation or divergence from those measures is not determinable from the supplied data.
Key levels
- 1.35203–1.35580: daily resistance and the most immediate upside test.
- 1.34713–1.35090: daily broken-retest support containing the latest close.
- 1.34592: the daily 0.236 Fibonacci level below current price.
- 1.33019–1.33396: former daily broken-retest resistance that may act as support if weakness extends.
- 1.31395–1.31772: lower daily support region, with 1.31395 also marking the completed-leg Fibonacci endpoint.
- 1.36977–1.37884: weekly broken-retest resistance that separates the current daily range from a stronger higher-timeframe recovery.
- 1.37797–1.38704: wider weekly resistance, with 1.38704 the most recent confirmed weekly high.
Conditional scenarios
Primary scenario: support holds and price tests resistance
Trigger: price continues to hold 1.34713–1.35090 and produces a sustained daily recovery through 1.35203–1.35580. Target zone: the next higher-timeframe area at 1.36977–1.37884, with the wider resistance zone at 1.37797–1.38704 becoming relevant if momentum persists. Invalidation: a sustained move below 1.34713–1.35090, particularly alongside a move through 1.34592. This is the highest-likelihood scenario while the weekly trend remains firm and no structure event is recorded.
Secondary scenario: range continuation
Trigger: price remains contained between the daily support zone at 1.34713–1.35090 and resistance at 1.35203–1.35580, without a confirmed close beyond either boundary. Target zone: the opposite side of that daily range, rather than a directional extension. Invalidation: a clear daily close outside the range, especially above 1.35580 or below 1.34713. This scenario fits the firm sideways daily trend.
Risk scenario: support failure
Trigger: sellers secure a daily close below 1.34713–1.35090 and then push beneath the nearby Fibonacci level at 1.34592. Target zones: the Fibonacci references at 1.33981, 1.33487 and 1.32994, followed by the daily broken-retest zone at 1.33019–1.33396 and the lower support at 1.31395–1.31772 if selling pressure expands. Invalidation: a recovery above 1.35203–1.35580, which would indicate that the breakdown has not held.
Closing assessment
- The weekly trend remains up and firm, but its sub-trend is down.
- The daily market is sideways and firm, with a down sub-trend.
- 1.34713–1.35090 is the immediate decision zone around the latest close of 1.34804.
- A recovery through 1.35203–1.35580 would improve the bullish case.
- A failure below 1.34592 would expose lower Fibonacci and support references.
The single most important question is whether daily price can defend 1.34713–1.35090 and reclaim 1.35203–1.35580, or whether sellers force continuation below 1.34592.
Tags: GBPUSD, forex, price action, Dow Theory, Fibonacci, technical analysis
Meta description: GBPUSD analysis: weekly trend remains firm while daily price tests 1.34713–1.35090 support below 1.35203–1.35580 resistance.
This article is technical analysis and reference information only, not investment advice. Markets carry risk, and readers are responsible for their own decisions.