
BTCUSD is trading at a cross-timeframe decision point. The weekly frame remains firmly bearish after a break of 65062.28, while the daily frame has developed an upward sub-trend from the confirmed low at 57704.79. The latest closed prices are 62758.29 on the weekly context frame and 64270.14 on the daily frame, leaving price above the daily broken-retest area but still below the broader weekly structure zone.
Higher-timeframe context — W1
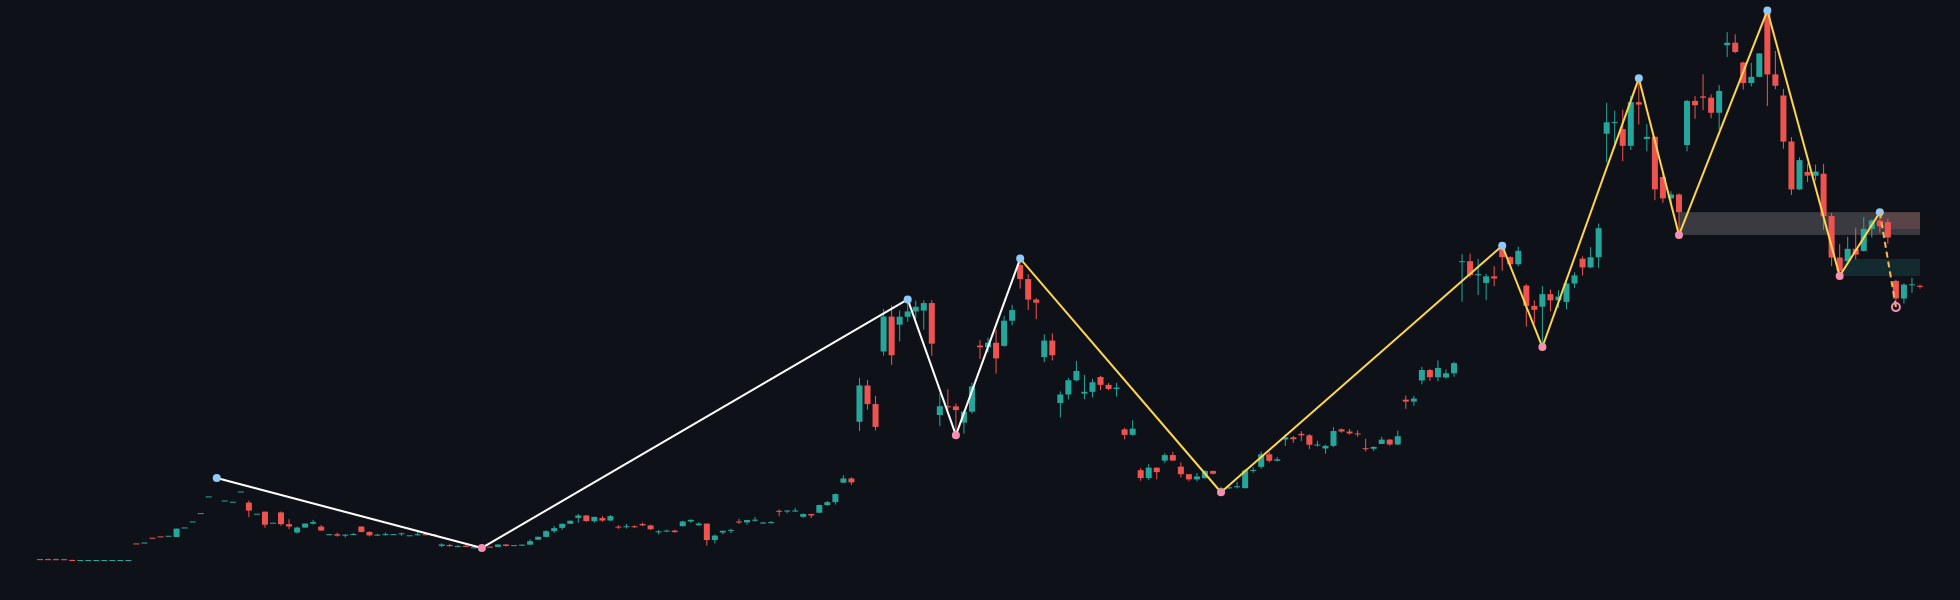
The weekly trend is down and the sub-trend is also down. The confirmed structure event is a break of 65062.28, which keeps the broader Dow structure bearish unless price can reclaim and hold the relevant zone above that level. The most recent confirmed swing is a high at 79513.01.
Price is positioned below the weekly support zone at 65062.28–68884.63. Because this area has been broken, it can now act as an overhead retest region. The principal weekly resistance areas are 75690.66–79513.01 and the broken-retest zone at 74364.56–79533.38. Weekly ATR is 7644.69, indicating that the distance between these zones is meaningful relative to recent weekly movement.
The weekly chart therefore permits a recovery attempt, but it favors bearish continuation while price remains below 65062.28–68884.63. A sustained move back through that zone would weaken the immediate bearish structure; rejection beneath it would preserve the downside framework.
Main-frame structure — D1
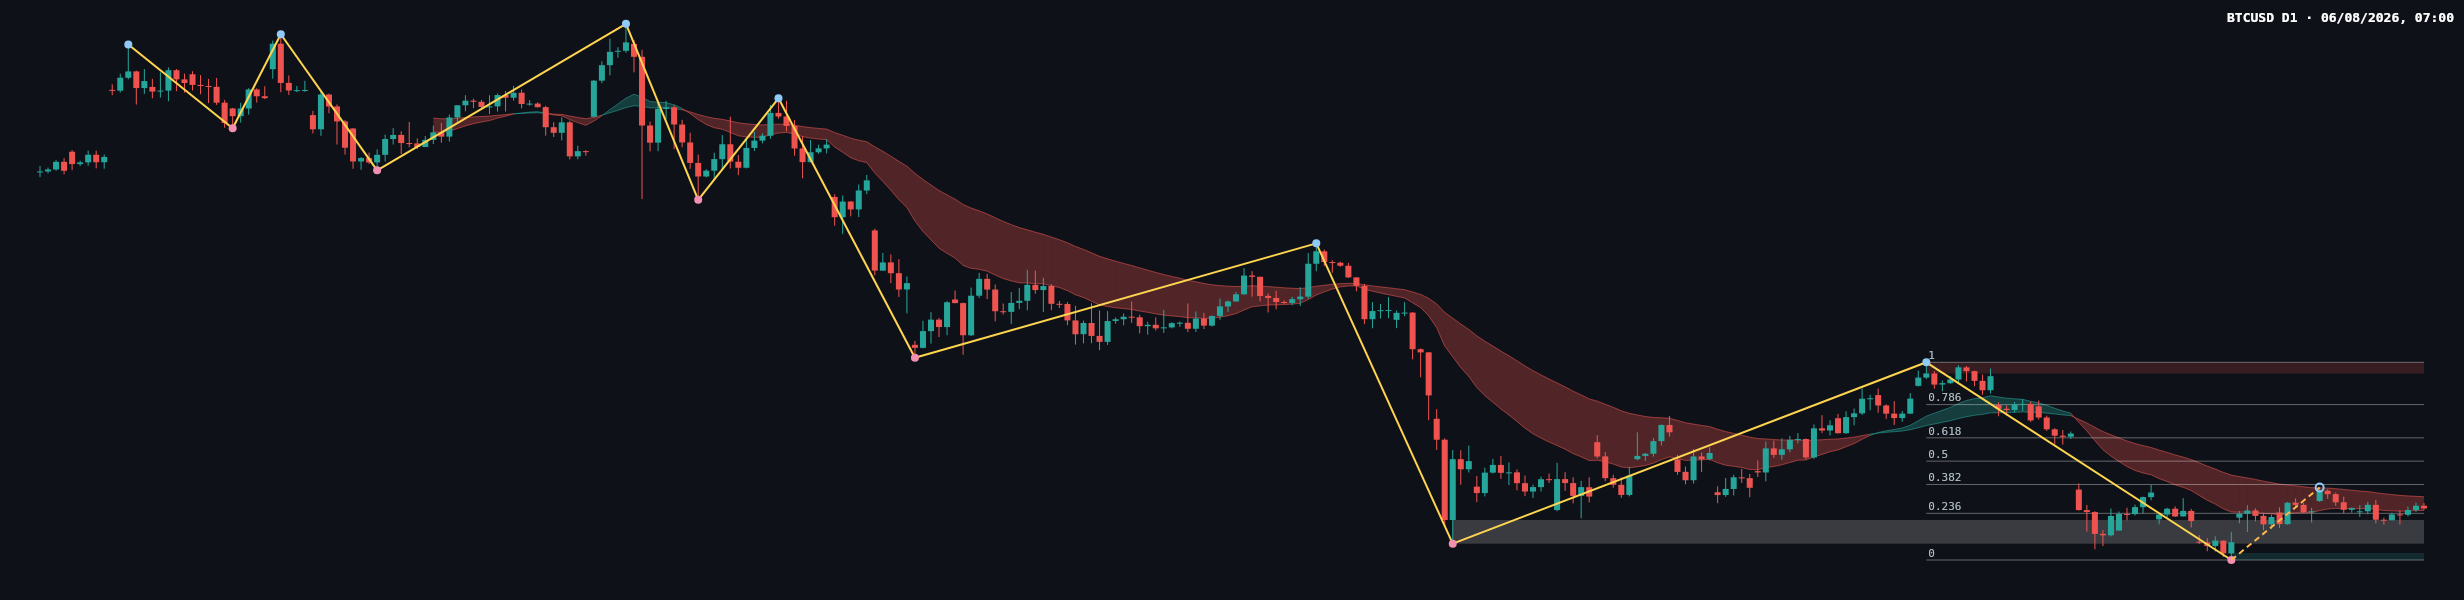
The daily main trend is down, while the sub-trend is up. This disagreement is consistent with a counter-trend recovery within a larger bearish structure rather than a confirmed reversal. No daily structure event is recorded, so the recent rise has not yet produced a confirmed break or change of character in the report.
The most recent confirmed daily swing is the low at 57704.79. The daily support zone is 57704.79–58590.32. Above current price, the broken-retest resistance zone is 59783.75–62793.85, while the higher resistance zone is 81426.29–82844.58. The daily ATR is 1771.06.
The latest completed Dow leg runs from 57704.79 to 82844.58. Its Fibonacci levels are 63637.78 at 0.236, 67308.19 at 0.382, 70274.69 at 0.5, 73241.18 at 0.618, and 77464.66 at 0.786. The current retracement ratio is 0.261, placing the recovery close to the 0.236 area at 63637.78 and below 67308.19.
On the daily image, the recent candles show a recovery into the overhead broken-retest region, followed by relatively compressed movement near the current close. This reflects a balance between buyers defending the recovery from 57704.79 and sellers responding around 62793.85 and the weekly level at 65062.28. The report does not provide volume data, so volume confirmation is not determinable from the report.
Key levels
| Area | Level or zone | Technical role |
|---|---|---|
| Weekly support and structure threshold | 65062.28–68884.63 | Former support area and the first major overhead test for a bullish recovery scenario |
| Daily broken-retest resistance | 59783.75–62793.85 | Important reaction area around the latest daily close |
| Daily Fibonacci reference | 63637.78 | 0.236 retracement level near the current retracement ratio of 0.261 |
| Next Fibonacci reference | 67308.19 | 0.382 retracement level and a deeper recovery threshold |
| Daily demand zone | 57704.79–58590.32 | Support beneath the current daily recovery |
| Higher resistance | 81426.29–82844.58 | Major upside supply zone if the broader structure improves |
Conditional scenarios
Bullish recovery scenario
If BTCUSD can establish acceptance above 65062.28–68884.63, the daily recovery would gain confirmation against the weekly bearish structure. The next Fibonacci reference would be 67308.19, followed by 70274.69 if momentum extends through the 0.382 area. This scenario would be invalidated by a failed reclaim followed by renewed acceptance below 59783.75–62793.85.
Bearish continuation scenario
If price is rejected around 63637.78, 62793.85, or the weekly threshold at 65062.28, sellers could reassert the weekly downtrend. A decisive loss of 59783.75–62793.85 would expose the lower daily support zone at 57704.79–58590.32. This scenario would be weakened if price reclaims and holds above 65062.28–68884.63.
Range and failed-break scenario
Price may continue to rotate between the daily broken-retest area at 59783.75–62793.85 and the weekly support zone at 65062.28–68884.63 without producing a confirmed daily structure event. A failed move above 65062.28 followed by a return below 63637.78 would favor a bearish interpretation; a failed move below 59783.75 followed by recovery above 62793.85 would instead keep the daily upward sub-trend active.
Reading the latest close
The latest reported daily close is 64270.14, while the weekly context close is 62758.29. The daily close is above the broken-retest zone’s lower boundary at 59783.75 and above the upper boundary at 62793.85, but it remains below the weekly support zone beginning at 65062.28.
The latest candles appear compressed after the recovery, which suggests hesitation rather than a confirmed directional break. Buyers have retained the daily upward sub-trend from 57704.79, but sellers remain able to defend the area between 63637.78 and 65062.28. The decisive evidence would be acceptance beyond one of those boundaries rather than a single intraday probe.
Session outlook
- Constructive path: acceptance above 65062.28–68884.63 would favor continuation toward 67308.19 and potentially 70274.69. The invalidation condition is a return below 59783.75–62793.85.
- Defensive path: rejection below 65062.28 and renewed weakness beneath 59783.75–62793.85 would favor a retest of 57704.79–58590.32. The invalidation condition is a sustained reclaim of 65062.28–68884.63.
- Neutral path: continued consolidation between 59783.75–62793.85 and 65062.28–68884.63 would leave the market without a confirmed daily structure event.
The bias leans bearish on the higher timeframe, although the daily upward sub-trend remains active while price holds above 59783.75–62793.85.
Closing view
- The weekly trend is firmly down after the break of 65062.28.
- The daily trend remains down, but its sub-trend is up from 57704.79.
- The current retracement ratio is 0.261, near the 0.236 Fibonacci level at 63637.78.
- The main upside test is 65062.28–68884.63; the main downside support is 57704.79–58590.32.
- A confirmed daily structure event is still absent, so acceptance and rejection around the listed zones are more important than isolated wicks.
The single most important factor is whether price can hold above 65062.28–68884.63 or returns below 59783.75–62793.85.
Technical analysis is provided for reference only and is not investment advice. Markets carry risk, and readers are responsible for their own decisions.
#BTCUSD #Bitcoin #PriceAction #DowTheory #TechnicalAnalysis
Meta description: BTCUSD remains weekly bearish while the daily recovery tests key Fibonacci and broken-retest zones around 63637.78 and 65062.28.