
BTCUSD presents a mixed multi-timeframe picture. The weekly structure remains firmly bearish after a break of 65062.28, while the daily sub-trend is upward inside a broader daily downtrend. The latest daily close at 64053.10 is pressing against the upper boundary of the 62409.68–64061.34 broken-retest zone, making this the key area for the next directional signal.
Higher-timeframe context
The weekly chart remains in a firm downtrend, with the sub-trend also down. Its latest structure event is a break of structure at 65062.28. The most recent confirmed weekly swing is a high at 79513.01, and the last closed weekly price is 62758.29.
Price is trading below the weekly support zone at 65062.28–68962.46, which means that former support is currently acting as an overhead reference. The weekly resistance areas are positioned higher, at 75612.83–79513.01 and 74364.56–79533.38. The weekly ATR is 7800.35, indicating that the higher-timeframe structure allows for substantial movement around these zones.
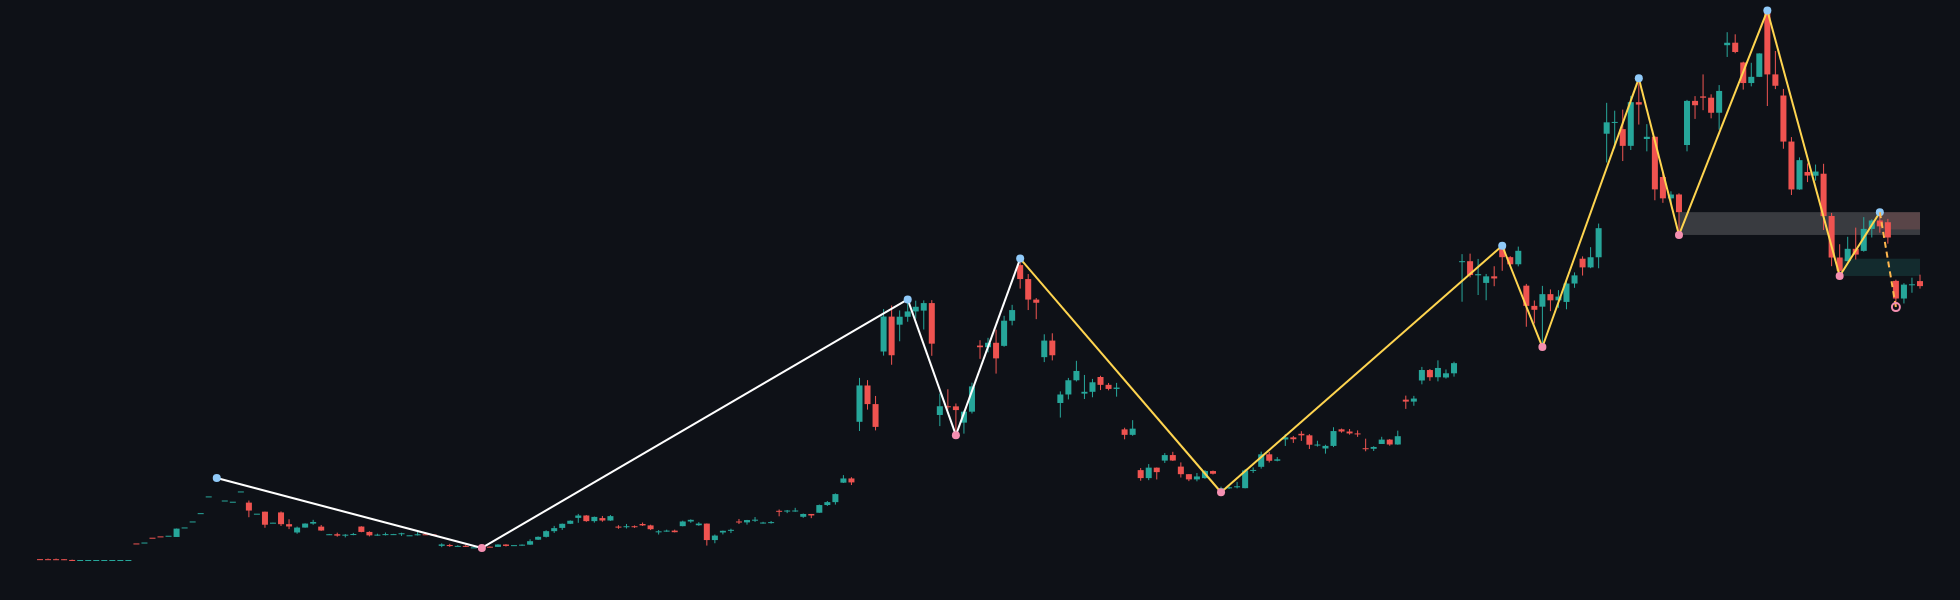
The weekly conclusion is conditional but cautious: the higher timeframe favors continuation of the bearish structure while price remains below 65062.28. A sustained recovery through the weekly support zone would be needed to weaken that interpretation.
Main-frame structure
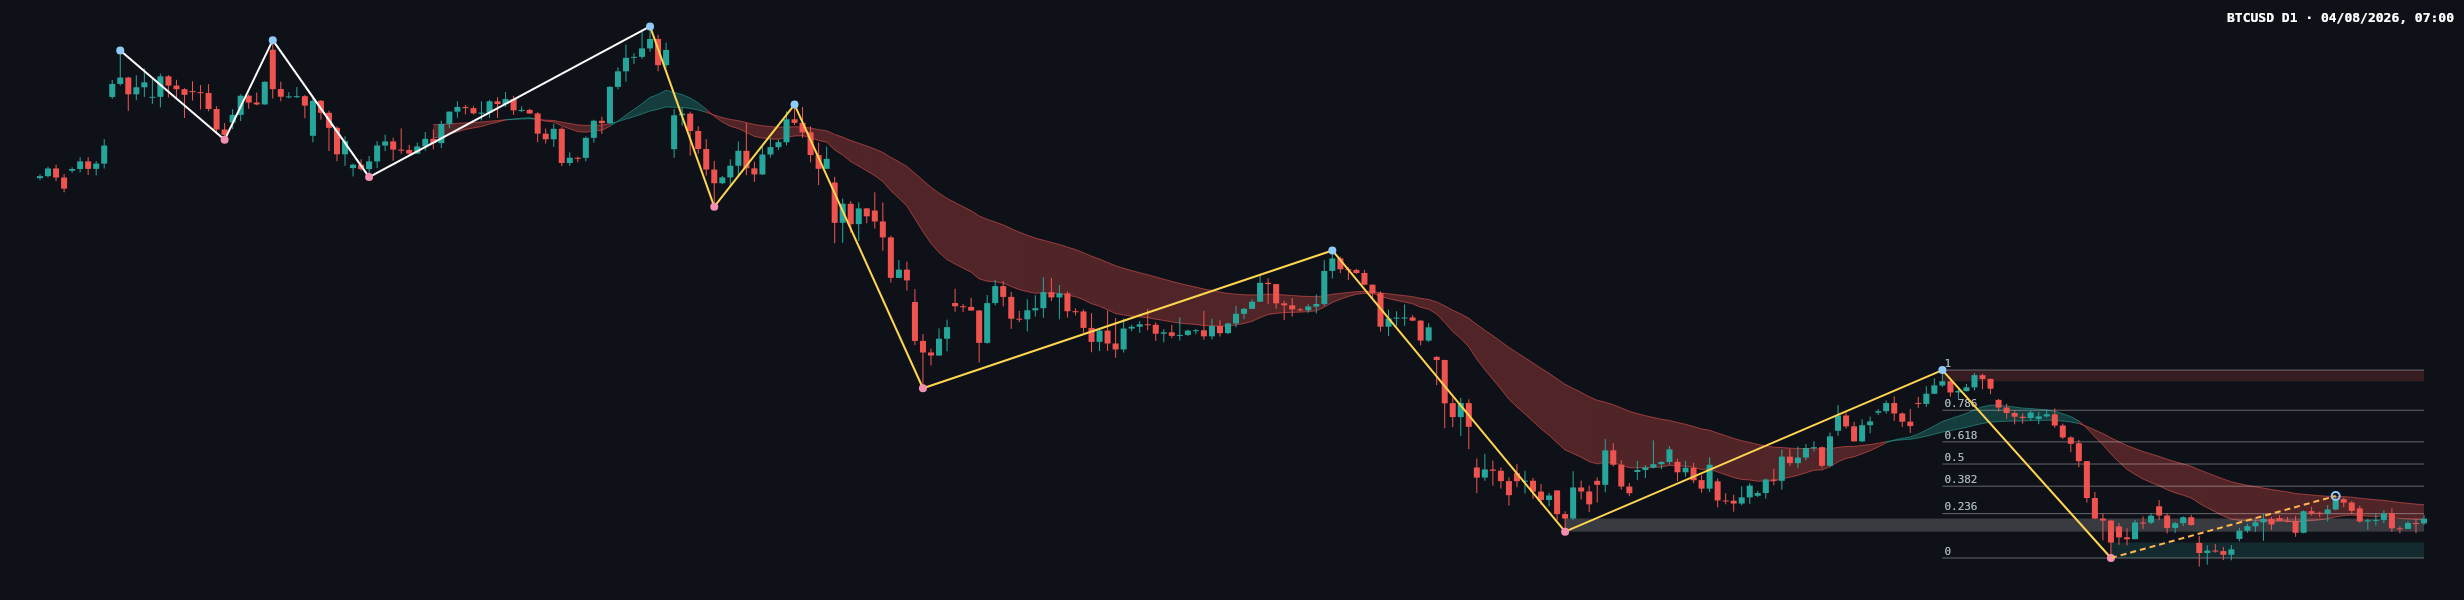
On the daily chart, the main trend is down, but the sub-trend is up. This divergence is consistent with a recovery inside a larger decline rather than a confirmed reversal. No daily structure event is recorded, and the most recent confirmed daily swing is a low at 59074.80.
The latest daily close at 64053.10 sits inside the 62409.68–64061.34 broken-retest resistance zone, very close to its upper boundary. The daily ATR is 1749.07. Above the current area, the next marked resistance zone is 81426.29–82844.58. Below, the main daily support zone is 59074.80–61030.48.
The latest completed Dow leg runs from 59074.80 to 82844.58. Its Fibonacci references are 0 at 59074.80, 0.236 at 64684.47, 0.382 at 68154.86, 0.5 at 70959.69, 0.618 at 73764.52, 0.786 at 77757.85, and 1 at 82844.58. The current retracement ratio is 0.209, below the 0.236 reference at 64684.47.
Recent price action
The latest visible daily candle is relatively small-bodied compared with the larger directional candles that preceded it. It closes near the upper edge of the current broken-retest zone, but it has not clearly reclaimed 64061.34. This suggests that buyers have stabilized price in the short term, while sellers remain active around the former support area.
The recent sequence shows a recovery from the 59074.80 swing low followed by hesitation near the broken-retest zone. The daily moving-average ribbon shown on the chart remains aligned with the broader downward structure, so the short-term advance has not yet produced a confirmed daily reversal. Momentum is therefore best read through the reaction to 64061.34 and 64684.47, rather than through the recovery alone.
Key levels
- 64053.10: latest closed daily price.
- 62409.68–64061.34: daily broken-retest resistance zone currently being tested.
- 64684.47: daily Fibonacci 0.236 reference above the current zone.
- 65062.28–68962.46: weekly support zone that price is currently below.
- 59074.80–61030.48: daily support zone below the market.
- 68154.86: daily Fibonacci 0.382 reference.
- 70959.69: daily Fibonacci 0.5 reference.
- 73764.52: daily Fibonacci 0.618 reference.
- 75612.83–79513.01 and 74364.56–79533.38: higher-timeframe resistance areas.
- 81426.29–82844.58: upper daily resistance zone.
Scenarios
Bullish scenario
If daily price reclaims and holds above 64061.34, the recovery could extend toward the Fibonacci reference at 64684.47. A further move above 64684.47 would bring the weekly level at 65062.28 into focus. This scenario would be weakened if price falls back below 62409.68 after failing to hold the broken-retest zone.
Bearish scenario
If price is rejected from 62409.68–64061.34 and moves below 62409.68, the daily recovery would be losing its immediate support. The next important area to observe would be 59074.80–61030.48, with the confirmed swing low at 59074.80 marking the key structural reference. This bearish scenario would be challenged by a sustained reclaim of 64061.34.
Range and failed-break scenario
Price may continue consolidating between the broken-retest zone at 62409.68–64061.34 and the nearby Fibonacci reference at 64684.47. A brief move above 64061.34 that fails to hold, or a brief move below 62409.68 that quickly returns into the zone, would indicate unresolved balance rather than a confirmed directional break.
Closing view
The daily chart is attempting to recover, but the weekly downtrend remains the dominant context. The most important observation is whether price can establish itself above 64061.34 and then challenge 64684.47, or whether rejection sends price back toward 59074.80–61030.48.
#BTCUSD #Bitcoin #TechnicalAnalysis #PriceAction #DowTheory
Meta description: BTCUSD tests the 62409.68–64061.34 broken-retest zone as weekly weakness meets a daily recovery.
This article is technical analysis and reference information only, not investment advice. Markets carry risk, and readers are responsible for their own decisions.