
BTCUSD closed the daily session at 63459.61, while the higher-timeframe close stands at 62758.29. The broader structure remains bearish: the weekly chart records a break of structure through 65062.28, whereas the daily chart is attempting a counter-trend recovery from the support zone at 57999.47–59709.10. Price is now near the upper boundary of the daily broken-retest zone at 59783.75–62793.85, making acceptance or rejection around this area the central issue.
| Metric | Reading |
|---|---|
| Daily close | 63459.61 |
| Weekly close | 62758.29 |
| Weekly trend | Down, firm |
| Daily trend | Down, with an upward sub-trend |
| Nearest daily resistance area | 59783.75–62793.85 broken-retest zone |
| Higher resistance area | 81426.29–82844.58 |
| Daily support area | 57999.47–59709.10 |
| Active Fibonacci reference | 63862.92, with the current retracement ratio at 0.220 |
Higher-timeframe context
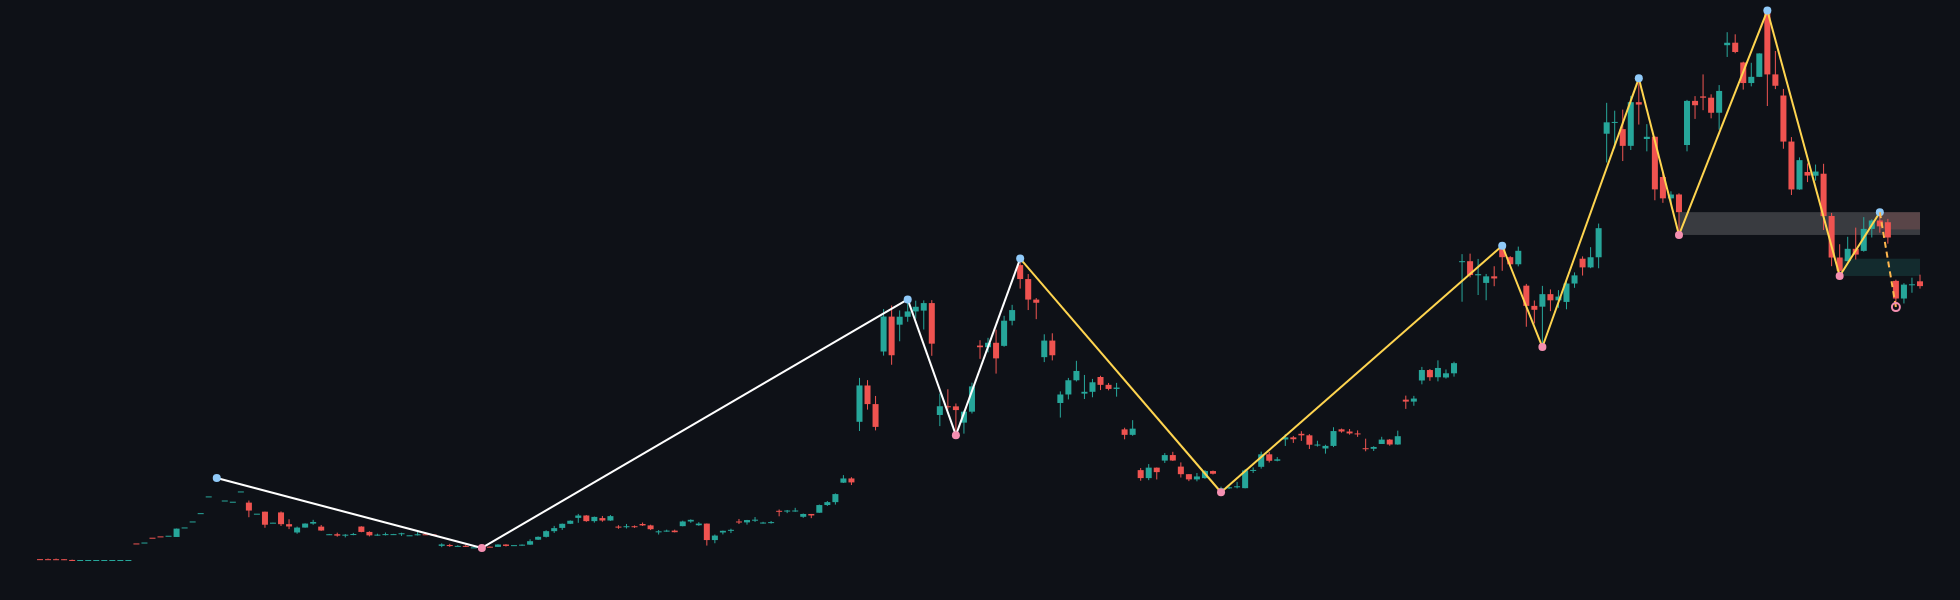
The weekly framework is decisively negative. Its main trend and sub-trend are both down, and the recorded break of structure occurred at 65062.28. The latest confirmed weekly price is 62758.29, below the weekly support zone at 65062.28–68962.46. This means the former support area is currently overhead rather than beneath price.
The weekly resistance map includes 75612.83–79513.01 and a broken-retest area at 74364.56–79533.38. The most recent confirmed weekly swing high is 79513.01. These zones define substantial overhead supply if the daily recovery develops into a broader advance. The weekly ATR is 7800.35, indicating that the higher-timeframe structure allows wide price movement, but it does not by itself change the bearish direction.
No weekly Fibonacci levels are provided in the deterministic report. The weekly chart therefore offers a directional framework through its broken structure and zones rather than a precise retracement reference. The higher timeframe permits counter-trend rebounds, but it favours bearish continuation while price remains below the broken weekly support zone.
Main-frame structure
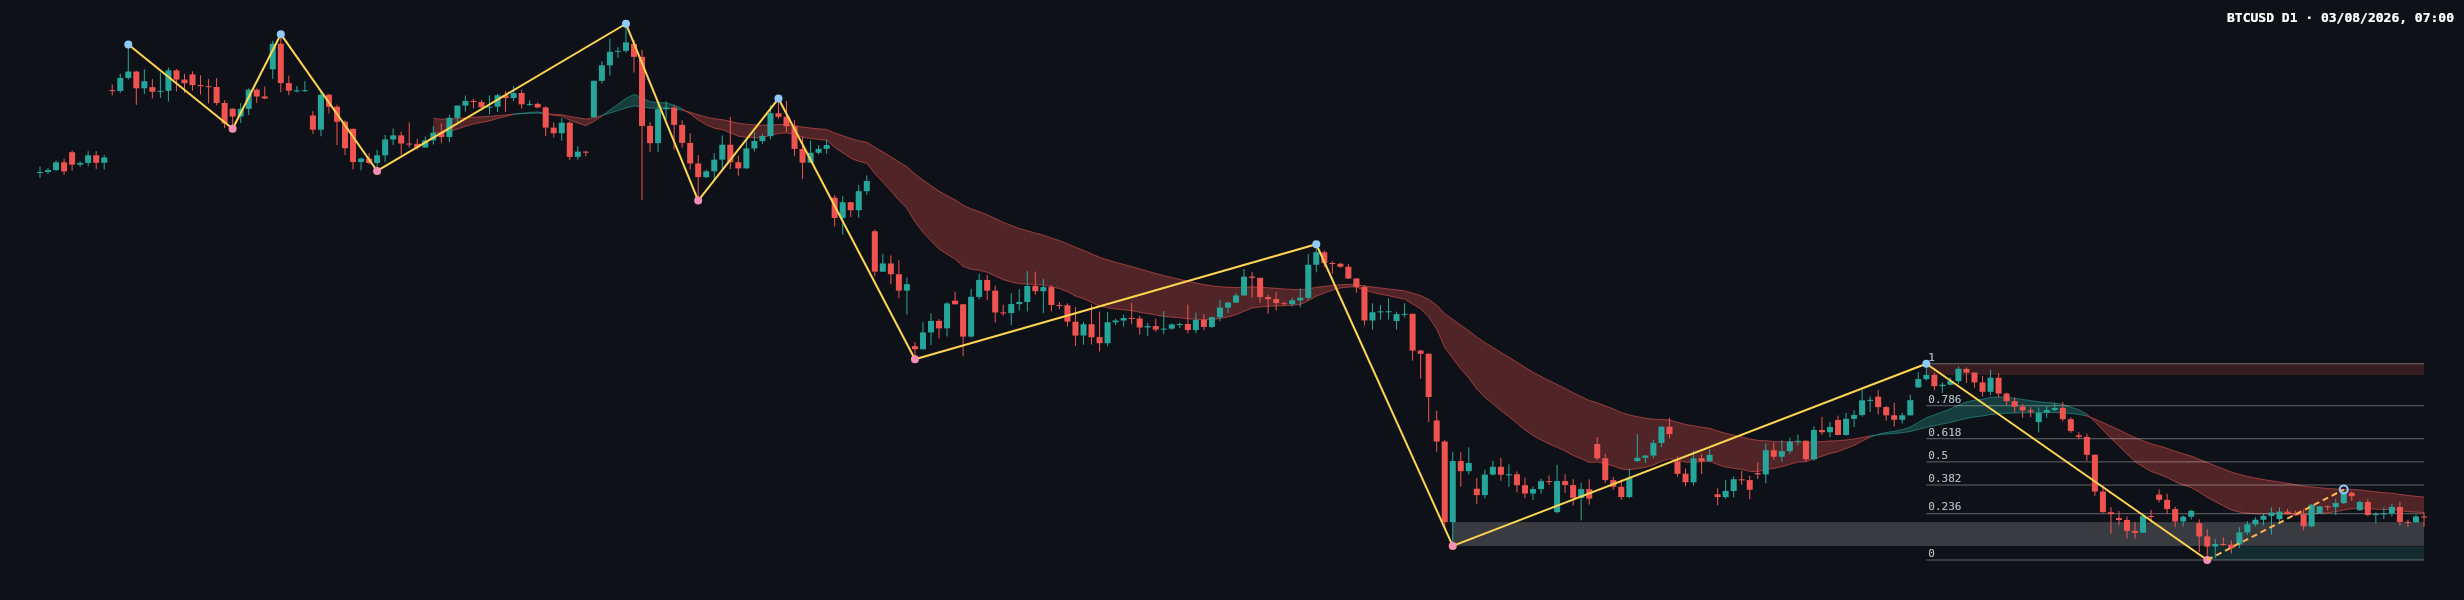
The daily chart remains in a firm downtrend, so it is not aligned with the daily sub-trend, which is up. The upward movement is therefore best treated as a recovery within a larger bearish structure unless the market establishes a new daily structure event. The report identifies no daily BOS or CHoCH, and the most recent confirmed daily swing is the low at 57999.47.
The daily recovery has carried price from the support area at 57999.47–59709.10 toward the broken-retest zone at 59783.75–62793.85. The latest close at 63459.61 is above that zone, but the close alone does not confirm a durable structural reversal. The daily ATR is 1807.84, so follow-through and repeated closes will be more informative than a single move through a boundary.
The daily Fibonacci sequence runs from 57999.47 to 82844.58. The first retracement reference is 63862.92, followed by 67490.30, 70422.02, 73353.75, and 77527.73. With the current retracement ratio at 0.220, price is still below the 0.236 reference at 63862.92. That places the current recovery close to an early Fibonacci test rather than a mature retracement.
The supplied report does not provide numerical moving-average readings, so the exact moving-average values, spacing and crossover status are not determinable from the report. The chart shows the moving-average envelope overhead and around the recovery area, but the analysis should not assign unreported levels to those lines.
Key levels and recent price behaviour
The primary daily reference is the broken-retest zone at 59783.75–62793.85. Sustained acceptance above its upper boundary would improve the case for a continued recovery toward 63862.92 and potentially the higher Fibonacci references. A failure back into the zone would instead suggest that the breakout has not yet produced reliable demand.
Below the market, the main daily support zone is 57999.47–59709.10. This area contains the latest confirmed swing low at 57999.47. A return to this zone would place the bullish daily recovery under pressure. A break beneath it would reinforce the weekly bearish structure and reopen the question of continuation toward lower, unreported levels.
Above the current Fibonacci reference, the next levels are 67490.30, 70422.02, 73353.75, and 77527.73. These should be treated as reaction points rather than predictions. The distant daily resistance zone at 81426.29–82844.58 frames the upper boundary of the measured leg, while the weekly resistance zones at 75612.83–79513.01 and 74364.56–79533.38 could create additional supply before that area.
Conditional scenarios
- Bullish recovery scenario: If daily price sustains acceptance above 62793.85 and then clears 63862.92, the recovery could extend toward 67490.30. The scenario would be weakened by a return below 62793.85 and invalidated as a recovery structure if price falls back through the daily support zone at 57999.47–59709.10. Probability is not determinable from the supplied report.
- Bearish rejection scenario: If price rejects the area around 63862.92 or falls back below 62793.85, sellers could regain control of the broken-retest zone. A deeper decline would bring the support zone at 57999.47–59709.10 back into focus. This scenario is invalidated by sustained acceptance above 63862.92 followed by progress toward 67490.30. Probability is not determinable from the supplied report.
- Wider continuation scenario: If the recovery develops beyond 67490.30, the next measured references are 70422.02, 73353.75, and 77527.73, with weekly resistance beginning at 74364.56–79533.38. The scenario would lose validity if price is rejected back below 62793.85. Probability is not determinable from the supplied report.
What to monitor
- Watch the interaction between 62793.85 and 63862.92; this is the immediate boundary between a sustained recovery attempt and a possible rejection.
- Monitor the support zone at 57999.47–59709.10, especially the confirmed swing low at 57999.47.
- For a stronger bullish reading, the market would need continued acceptance above the broken-retest zone and progress through 63862.92.
- For a stronger bearish reading, look for rejection from the Fibonacci area and renewed closes below 62793.85.
- False breaks are possible around both the broken-retest zone and the first Fibonacci reference. A single candle should therefore be weighed against subsequent closes and the wider weekly structure.
Summary
- The weekly trend is firmly down after the break of 65062.28.
- The daily chart has an upward sub-trend, but no daily structure event has been recorded.
- The daily close at 63459.61 is testing the area above the broken-retest zone at 59783.75–62793.85.
- 63862.92 is the first Fibonacci reference, while 57999.47–59709.10 remains the key support area.
- The broader bias remains bearish unless the recovery builds sustained structure above the nearby Fibonacci and resistance references.
The single most important factor is whether price can hold above 62793.85 and move through 63862.92, or instead fall back into the broken-retest zone.
This article is technical analysis and reference information only, not investment advice. Markets carry risk, and readers are responsible for their own decisions.