
BTCUSD closed at 62758.29. The higher-timeframe structure remains firmly bearish after a break of structure at 65062.28, while the daily frame is attempting a counter-trend recovery. Price is currently positioned between the daily resistance zone at 66281.39–67264.32 and the support zone at 57704.79–58611.80, leaving both continuation and recovery scenarios open.
Higher-timeframe context
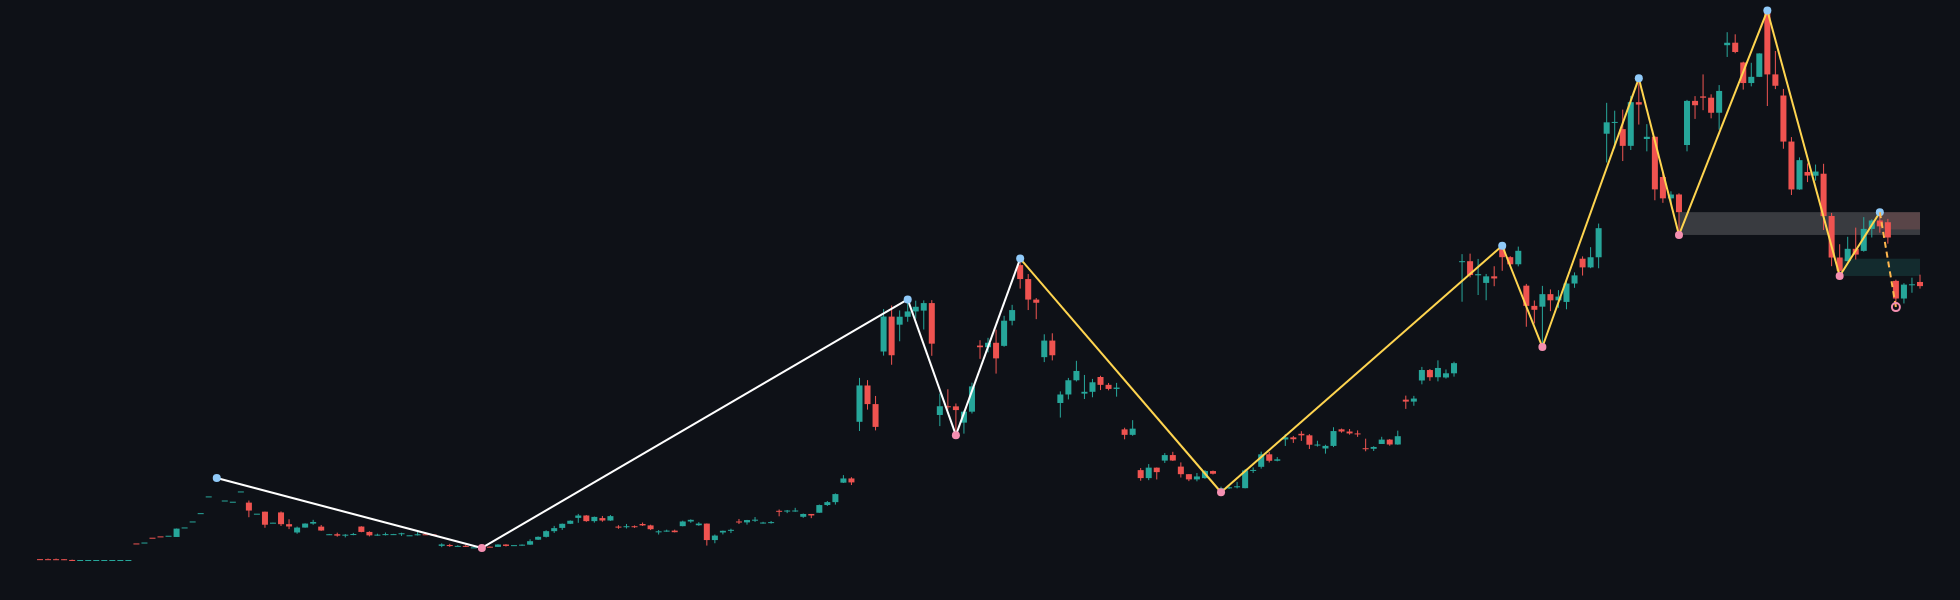
The weekly trend is down and the weekly sub-trend is also down. The confirmed structure event is a bearish break of structure at 65062.28, which keeps the broader directional framework negative while price remains below that area.
The weekly support zone is 65062.28–68962.46. Because the last closed price of 62758.29 is below this zone, the former support area is now an important overhead test rather than a confirmed base. Weekly resistance is located at 75612.83–79513.01, with a broken-retest resistance zone at 74364.56–79533.38. The most recent confirmed weekly swing high is 79513.01.
The weekly ATR is 7800.35, indicating a wide higher-timeframe range. No weekly Fibonacci levels are supplied in the report, so interaction with a weekly Fibonacci level is not determinable from the available data.
Main-frame structure
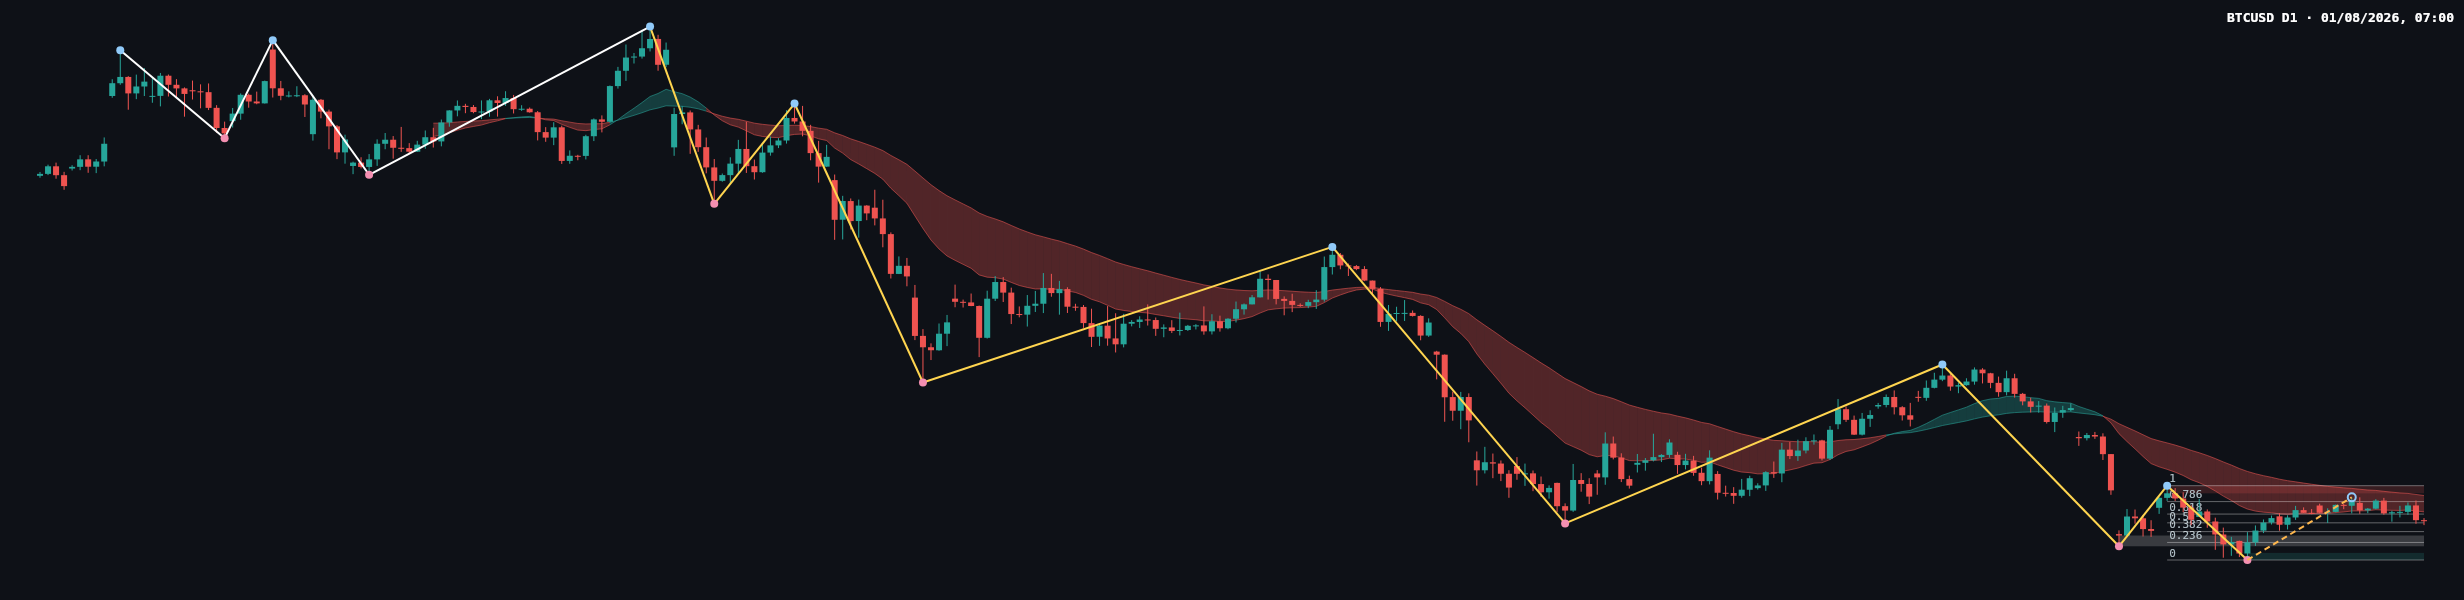
On the daily frame, the main trend is down, but the sub-trend is up. This creates a clear multi-timeframe conflict: the daily advance can be treated as a counter-trend recovery while price remains below the daily resistance zone at 66281.39–67264.32. The daily report records no confirmed structure event, so there is no verified daily BOS or CHoCH to establish a larger reversal.
The most recent confirmed daily swing low is 57704.79. The daily support zone extends from 57704.79 to 58611.80. A broken-retest resistance zone is positioned at 59472.70–60849.22, and price at 62758.29 is above that area. This means the zone may be relevant as a lower reference if the recovery loses momentum.
The daily ATR is 1814.02. The latest completed Dow leg runs from 57704.79 to 67264.32. Its Fibonacci levels are 59960.84 at 0.236, 61356.53 at 0.382, 62484.56 at 0.5, 63612.58 at 0.618, and 65218.58 at 0.786. The current retracement ratio is 0.529, placing price close to the 0.5 level at 62484.56 and below the 0.618 level at 63612.58.
Key levels
| Area | Level or zone | Technical relevance |
|---|---|---|
| Current close | 62758.29 | Reference point for the daily recovery |
| Fibonacci midpoint | 62484.56 | 0.5 retracement of the latest completed leg |
| Fibonacci resistance | 63612.58 | 0.618 retracement |
| Daily resistance | 66281.39–67264.32 | Primary barrier for a larger bullish shift |
| Weekly support and broken structure | 65062.28–68962.46 | Overhead weekly retest area |
| Daily broken-retest resistance | 59472.70–60849.22 | Potential lower reference during weakness |
| Daily support | 57704.79–58611.80 | Major downside structure area |
Conditional scenarios
Primary scenario: rejection beneath daily resistance
If the recovery fails below 66281.39–67264.32, the weekly downtrend remains the dominant context. A move back toward 62484.56, followed by the broken-retest zone at 59472.70–60849.22, would be consistent with renewed pressure. The scenario is invalidated by sustained acceptance above 67264.32, because that would place price beyond the defined daily resistance zone.
Secondary scenario: continued daily recovery
If price holds above 62484.56 and advances through 63612.58, the next retracement reference is 65218.58. A continuation toward 66281.39–67264.32 would then bring the daily recovery into its main resistance area. This scenario is invalidated by a return below 62484.56, particularly if the broken-retest zone at 59472.70–60849.22 is revisited.
Risk scenario: broader support failure
If selling pressure extends through 59472.70–60849.22, attention shifts to 57704.79–58611.80. A break below 57704.79 would weaken the current daily recovery structure and reinforce the weekly bearish framework. This scenario is invalidated if price reclaims and holds above 63612.58 while progressing toward 65218.58.
Probability estimates are not assigned because the deterministic report provides no statistical probability model. The directional bias therefore remains conditional: bearish while below 66281.39–67264.32, but with a daily recovery still active above 62484.56.
What the latest candle can and cannot confirm
The deterministic report identifies the latest close at 62758.29, but it does not provide the candle’s open, high, low, body, or wick measurements. A precise classification as a pin bar, doji, engulfing candle, or another candle type is therefore not determinable from the report.
The close is above the daily broken-retest resistance zone at 59472.70–60849.22 and near the Fibonacci midpoint at 62484.56. The available data support monitoring whether subsequent closes remain above 62484.56 or return below it; they do not independently confirm buyer or seller control without additional candle data.
Key considerations
- Monitor 63612.58 and 65218.58 as intermediate Fibonacci references.
- Monitor 66281.39–67264.32 as the principal daily resistance zone.
- Monitor 59472.70–60849.22 as the broken-retest area beneath price.
- Monitor 57704.79–58611.80 as the major daily support zone.
- For confirmation of recovery, look for sustained closes above the relevant Fibonacci references and progress toward 66281.39–67264.32.
- For confirmation of renewed weakness, look for rejection below 66281.39–67264.32 followed by deterioration through 62484.56 and 59472.70–60849.22.
News, volume, momentum readings, session-specific behavior, and exact EMA values are not included in the deterministic report. Their influence is therefore not determinable here and should not be inferred from the chart alone.
Closing view
BTCUSD remains in a firmly bearish weekly structure after the break at 65062.28, while the daily sub-trend is still attempting to recover. The central technical test is whether price can build above 63612.58 and 65218.58 on the way toward 66281.39–67264.32, or whether rejection there sends the market back toward 62484.56 and the lower support references.
This article is technical analysis for reference only, not investment advice. Markets carry risk, and readers are responsible for their own decisions.