
XAU/USD closed at 4166.029, within the daily 4165.881–4203.224 broken-retest support zone. The primary trend remains up on both the weekly and daily frames, while each has a down sub-trend; this leaves gold in a corrective phase where the nearby zone and lower Fibonacci levels are important reference points.
Higher-timeframe context — weekly
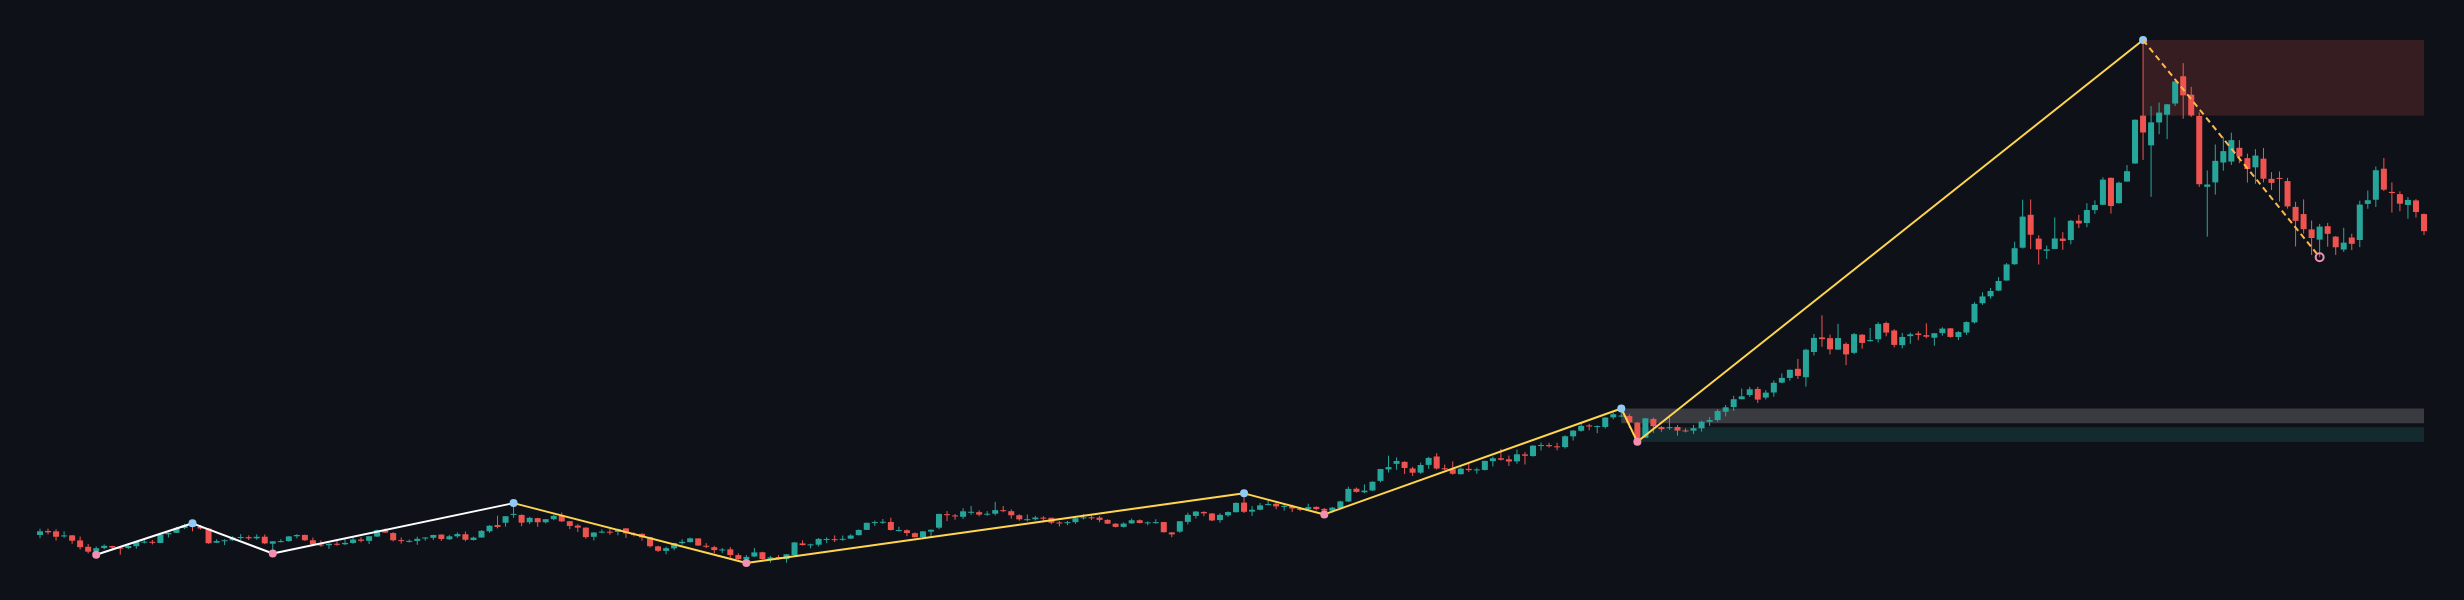
The weekly primary trend is up, described in the report as firm, with a down sub-trend. No structure event is reported. The chart shows a substantial advance followed by a pullback from the most recent confirmed swing high at 5595.362; the correction is notable, but the available structure data does not confirm a weekly trend break.
The weekly support zones are 2536.779–2648.483 and the broken-retest area at 2678.395–2790.099. Weekly resistance is 5019.871–5595.362. With the weekly close at 4140.348, price is below that resistance and above the reported support zones. Weekly EMA values and their relationship to price are not determinable from the report.
Weekly view: the larger trend still permits a recovery, but the down sub-trend argues for caution until price shows renewed strength. A continued correction remains possible if lower support references come into play.
Main-frame structure — daily
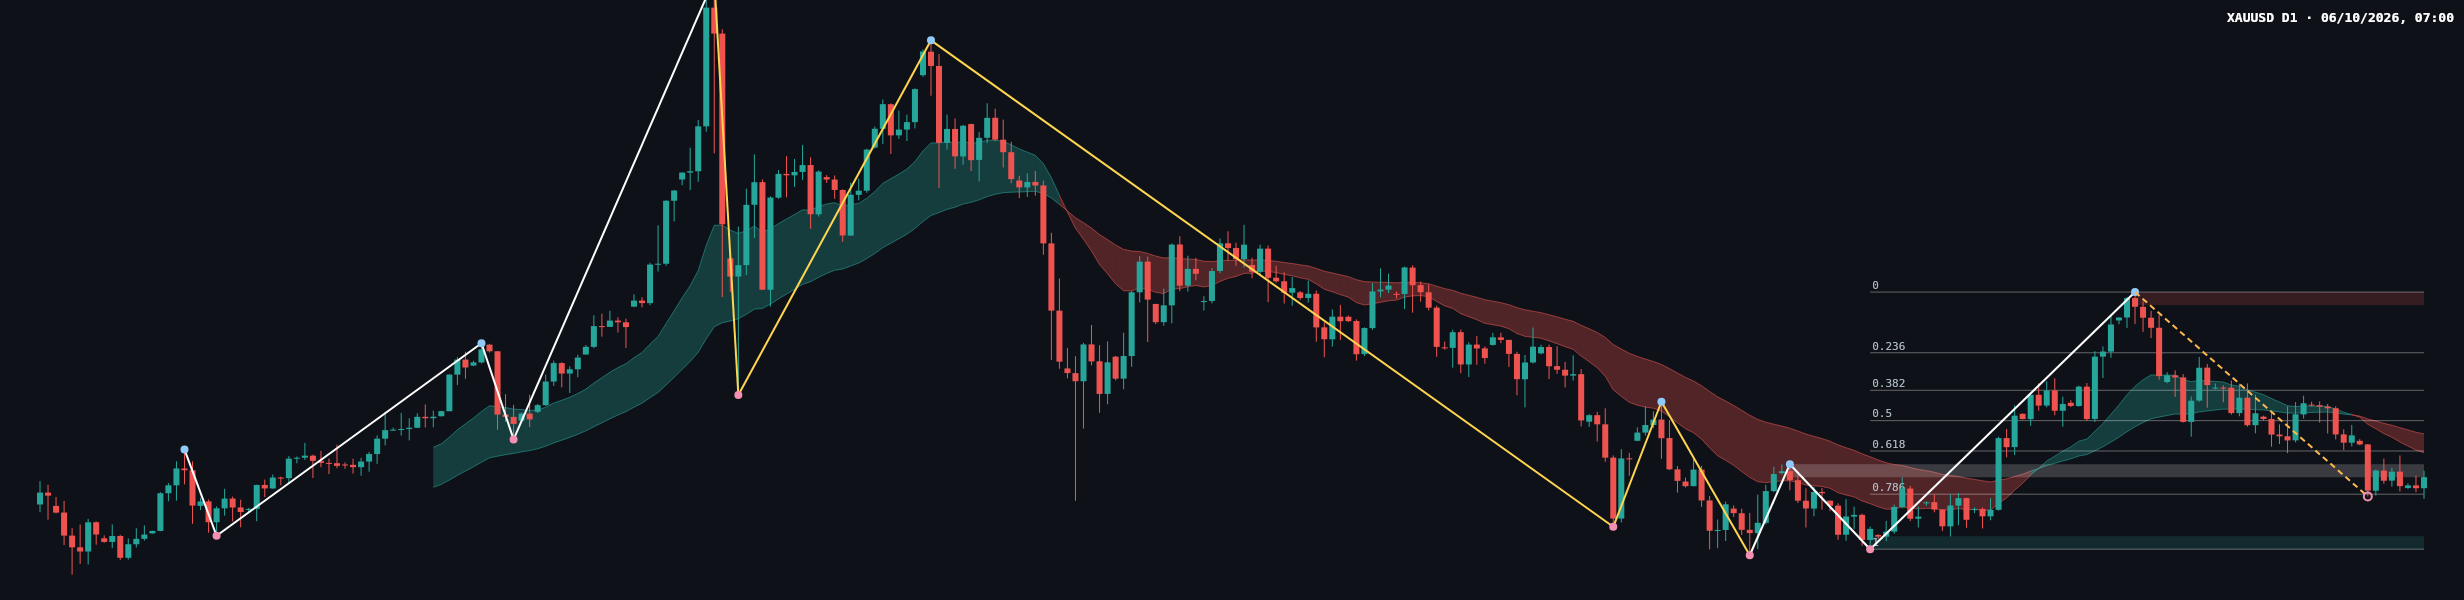
The daily primary trend is also up, while the sub-trend is down, so the frames agree on the direction of the correction within the broader advance. No daily structure event is reported. The chart’s declining indicator band is consistent with near-term pressure, but exact EMA readings, spacing, and crossover status are not provided.
The most recent confirmed daily swing high is 4697.097. The daily resistance zone is 4659.754–4697.097, while support is marked at 3959.396–3996.739 and at the broken-retest zone of 4165.881–4203.224. The latest close sits within the latter zone, close to its lower boundary.
The completed Dow leg’s Fibonacci references are 4523.000 at 0.236, 4415.295 at 0.382, 4328.247 at 0.5, 4241.198 at 0.618, 4117.264 at 0.786, and 3959.396 at 1. The current retracement ratio is 0.720, between 0.618 and 0.786. The chart therefore places price in the lower portion of the measured retracement, with 4117.264 and the daily support zone below as further references.
The individual wick and body measurements of the latest candles, their ranges versus prior sessions, and volume or momentum readings are not determinable from the report. The chart shows price consolidating near the broken-retest zone after a decline; that visual context alone does not establish whether buyers have taken control.
Key levels and closing-candle read
| Reference | Level or zone |
|---|---|
| Daily close | 4166.029 |
| Nearby broken-retest support | 4165.881–4203.224 |
| Fibonacci references | 4241.198 and 4117.264 |
| Lower daily support | 3959.396–3996.739 |
| Daily resistance | 4659.754–4697.097 |
The precise candle classification and close location within its range are not determinable from the report. The closing price is inside the broken-retest zone and below the 4241.198 Fibonacci reference. This is a location-based reading, not confirmation of a reversal or a fresh continuation move.
Scenarios
- Bullish case: If price holds the 4165.881–4203.224 zone and reclaims the 4241.198 reference, the corrective pressure could ease, with the higher Fibonacci levels at 4328.247 and 4415.295 becoming subsequent areas to monitor. A sustained move below 4117.264 would weaken this case. Probability is not determinable from the report.
- Bearish case: If price breaks below 4117.264 and cannot recover it, the correction could extend toward the daily support zone at 3959.396–3996.739. A sustained reclaim of 4203.224 would weaken this case. Probability is not determinable from the report.
- Consolidation case: If price continues to fluctuate around 4165.881–4203.224 without clearing 4241.198 or losing 4117.264, the corrective range may persist. A sustained move outside those references would invalidate the range interpretation. Probability is not determinable from the report.
The near-term read remains cautious while price is testing the broken-retest zone: holding it would keep recovery possibilities open, while a break lower would increase the relevance of the next support references.
Session considerations
No news or economic-calendar details are supplied, so event timing and fundamental catalysts cannot be assessed here. DXY, US yields, scheduled economic releases, and geopolitical headlines may affect gold; traders should check current sources rather than assume a particular event is scheduled. The chart and report do not establish how the Asian, European, or US session will behave.
False breaks and volatility can complicate interpretation around the marked zones. This analysis describes conditional market scenarios only; it does not prescribe entries, exits, or position size.
Summary
- Weekly and daily primary trends are up, while both sub-trends are down.
- The daily close at 4166.029 lies within 4165.881–4203.224.
- 4241.198 is a nearby Fibonacci reference above; 4117.264 is the next listed Fibonacci reference below.
- A hold and reclaim would improve the recovery picture; a break below the lower reference would put daily support at 3959.396–3996.739 in focus.
The key question is whether price can hold the broken-retest zone or instead give way toward lower support.
#XAUUSD #Gold #DailyAnalysis #TechnicalAnalysis #MarketOutlook
Meta description: XAU/USD daily analysis: gold tests broken-retest support as the primary trend stays up and the corrective sub-trend persists.
This article is technical analysis for reference only, not investment advice. Markets carry risk, and readers are responsible for their own decisions.