
XAU/USD closed at 4053.798 on the daily frame, leaving price inside the 4023.812–4062.120 broken-retest resistance zone. The broader weekly trend remains firmly up, while the daily trend is firmly down and its sub-trend is up. This conflict places the market at an important decision area rather than presenting a clear directional resolution.
Higher-timeframe context
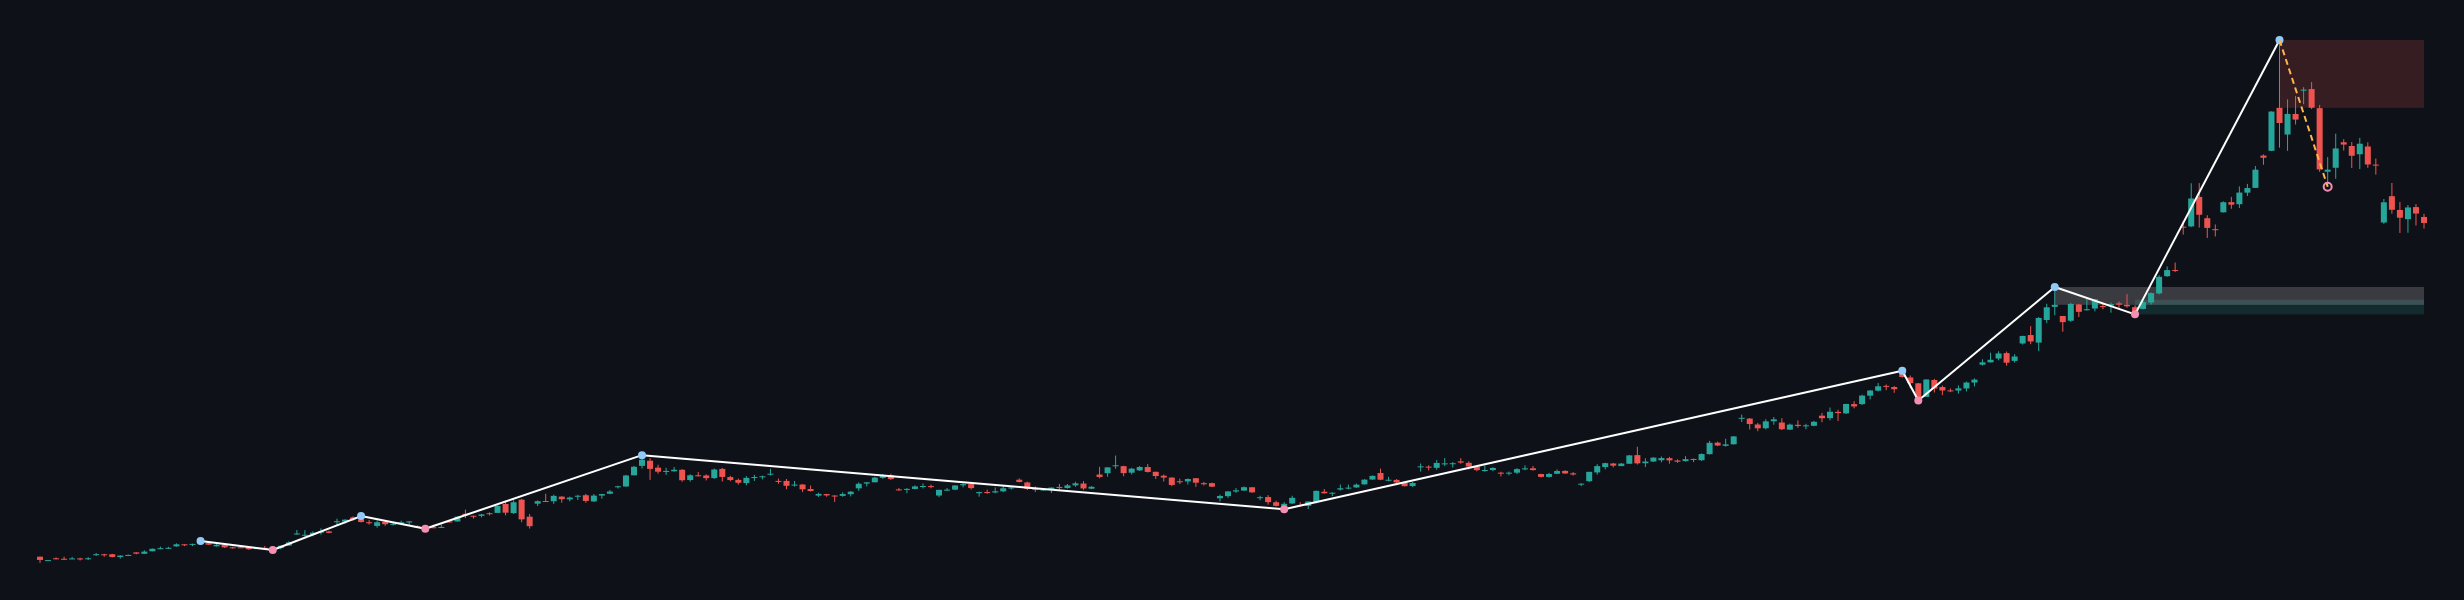
The weekly structure remains bullish, with the main trend classified as up and no confirmed structure event reported. The most recent confirmed weekly swing is a high at 5595.362, while the weekly sub-trend is down. That combination suggests a broader advance undergoing a corrective phase, but the report does not confirm a weekly break of structure.
Weekly moving-average positioning and crossover details are not determinable from the report. The larger chart nevertheless identifies a weekly support zone at 3268.058–3392.201 and a broken-retest support zone at 3349.000–3500.057. Above current price, the principal weekly resistance zone is 5019.871–5595.362.
The weekly ATR is 248.286, indicating that the higher-timeframe environment can accommodate materially wider movement than the daily ATR of 76.615. Price is not reported as interacting with a weekly Fibonacci level, so that element is not determinable from the available data.
Main-frame structure
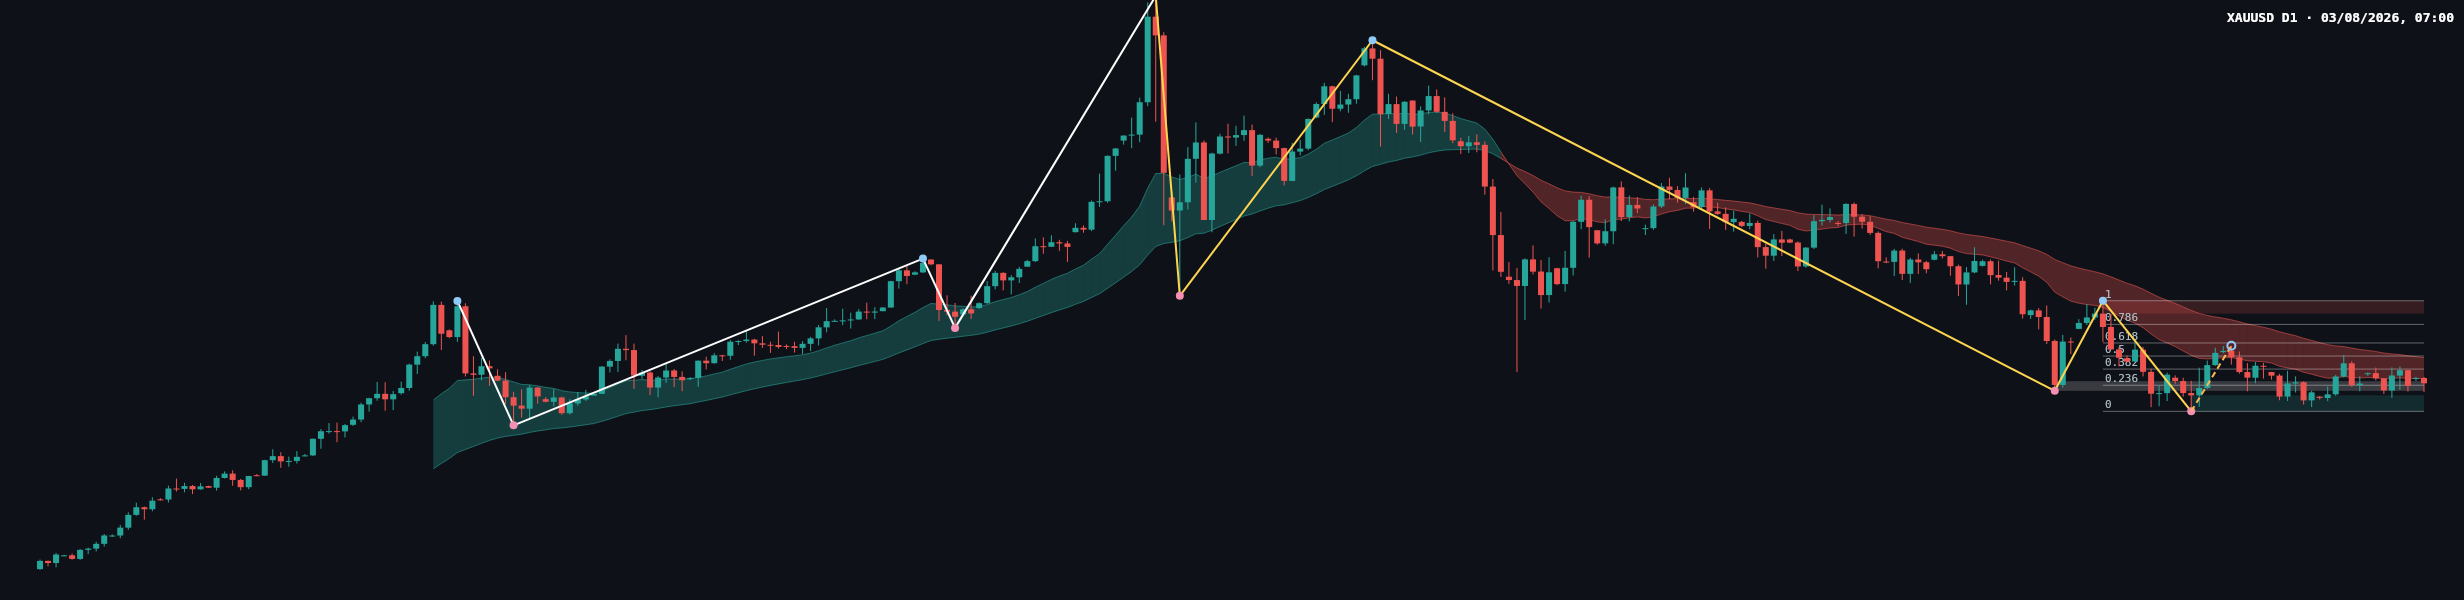
The daily main trend is firmly down, but the sub-trend is up. This is not aligned with the weekly direction and may represent a counter-trend recovery within the larger weekly correction. No daily structure event is reported, so there is no confirmed BOS or CHoCH to establish a new dominant direction.
The latest confirmed daily swing is a low at 3942.138. The daily support zone extends from 3942.138–4005.629, while the broken-retest resistance zone spans 4023.812–4062.120. Price at 4053.798 is therefore positioned within the resistance area, above the reported support zone and below the wider resistance zone at 4331.294–4382.441.
Daily EMA positioning, slope, spacing, and crossover status are not determinable from the deterministic report. The chart does show a recent recovery into overhead supply, but the numerical moving-average readings required for a precise assessment are unavailable.
Key levels and Fibonacci positioning
- 4053.798: last closed daily price.
- 4023.812–4062.120: daily broken-retest resistance zone currently containing price.
- 3942.138–4005.629: daily support zone and area surrounding the most recent confirmed swing low.
- 4331.294–4382.441: higher daily resistance zone.
- 4110.334: Fibonacci 0.382 level.
- 4162.290: Fibonacci 0.5 level.
- 4214.245: Fibonacci 0.618 level.
- 4288.216: Fibonacci 0.786 level.
The latest completed Dow leg runs from Fibonacci 0 at 3942.138 to Fibonacci 1 at 4382.441. The current retracement ratio is 0.254, placing the market close to the 0.236 level at 4046.050. This makes 4046.050 a useful reference inside the current decision area, although the report does not identify a separate structure event at that level.
Scenarios
Bullish continuation scenario
A daily acceptance above 4062.120 would strengthen the case that the current daily sub-trend is extending. The next Fibonacci references would be 4110.334, 4162.290, and 4214.245, with the broader daily resistance zone at 4331.294–4382.441 remaining overhead. This scenario would be invalidated by a return below 4023.812, particularly if that move is accompanied by a failed retest of the broken-retest zone. Probability is not determinable from the report.
Bearish rejection scenario
A rejection from 4023.812–4062.120, followed by sustained trade below 4023.812, would favor a return toward the daily support zone at 3942.138–4005.629. The most important downside reference within that area is the confirmed swing low at 3942.138. This scenario would be invalidated by a decisive daily acceptance above 4062.120. Probability is not determinable from the report.
Range and failed-break scenario
Price may continue to rotate between the broken-retest resistance zone at 4023.812–4062.120 and the support zone at 3942.138–4005.629 while the weekly and daily trends remain in conflict. A failed push above 4062.120 followed by a close back inside the zone would favor range conditions; a failed move below 4023.812 followed by recovery would similarly weaken the bearish signal. This scenario is invalidated by sustained acceptance beyond either boundary. Probability is not determinable from the report.
Reading the recent price action
The report does not classify the latest candle by pattern, nor does it provide its body, wick structure, range, or close location. Those details are therefore not determinable with sufficient precision. The available evidence is that the daily close at 4053.798 remains inside 4023.812–4062.120, while the current retracement ratio of 0.254 is near Fibonacci 0.236 at 4046.050.
On that basis, neither buyers nor sellers have secured a confirmed daily structure event. Buyers would need acceptance above 4062.120 to improve the recovery case; sellers would need rejection and follow-through below 4023.812 to expose the support zone at 3942.138–4005.629.
Key considerations
- Resistance: monitor 4023.812–4062.120 first, followed by 4331.294–4382.441 and the weekly zone at 5019.871–5595.362.
- Support: monitor 3942.138–4005.629, with the weekly areas at 3349.000–3500.057 and 3268.058–3392.201 as broader references.
- Confirmation: a daily close beyond 4062.120 or below 4023.812, followed by a credible retest, would provide stronger directional evidence than an intraday probe.
- Fibonacci: observe the relationship between 4046.050 and the current close at 4053.798; higher references are 4110.334, 4162.290, 4214.245, and 4288.216.
- Risk factors: false breaks, liquidity sweeps, and volatility around macroeconomic headlines can invalidate an apparent move through either boundary. The report provides no economic-calendar schedule or news context.
Summary
- The weekly trend is firmly up, with no reported weekly structure event.
- The daily trend is firmly down, while the daily sub-trend is up.
- Price at 4053.798 is inside the daily broken-retest resistance zone at 4023.812–4062.120.
- A bullish resolution requires acceptance above 4062.120; a bearish resolution requires sustained trade below 4023.812.
- The single most important consideration is whether the current zone produces acceptance or rejection.
XAU/USD remains a market of competing timeframes, with the weekly uptrend opposing the daily downtrend. Until price resolves the 4023.812–4062.120 zone, conditional analysis is more appropriate than assuming a confirmed directional breakout.
This article is technical analysis and reference information only, not investment advice. Markets carry risk, and readers are responsible for their own decisions.