
XAU/USD is presenting a mixed multi-timeframe picture. The Weekly trend remains firmly up, but its sub-trend is down; on the Daily frame, the main trend is firmly down while the sub-trend is up. The most notable feature is the recovery from the Daily swing low at 3942.138 toward the Fibonacci 0.382 level at 4110.334, with price still below the broader resistance zone at 4331.294–4382.441.
| Metric | Value |
|---|---|
| Weekly last closed price | 4052.808 |
| Daily last closed price | 4105.933 |
| Weekly / Daily trend | Up firmly / down firmly |
| Weekly ATR / Daily ATR | 269.830 / 80.712 |
| Nearest Daily resistance | 4331.294–4382.441 |
| Nearest Daily support | 3942.138–4005.629 |
| Active Fibonacci level | 0.382 at 4110.334; current retracement ratio 0.372 |
Higher-timeframe context
The Weekly structure continues to describe a firm uptrend, with the most recent confirmed swing a high at 5595.362. The report identifies no structure event, so there is no confirmed Weekly break of structure to override that larger directional framework. The current Weekly sub-trend is down, which indicates a corrective phase within the wider advance rather than a confirmed change of the primary trend.
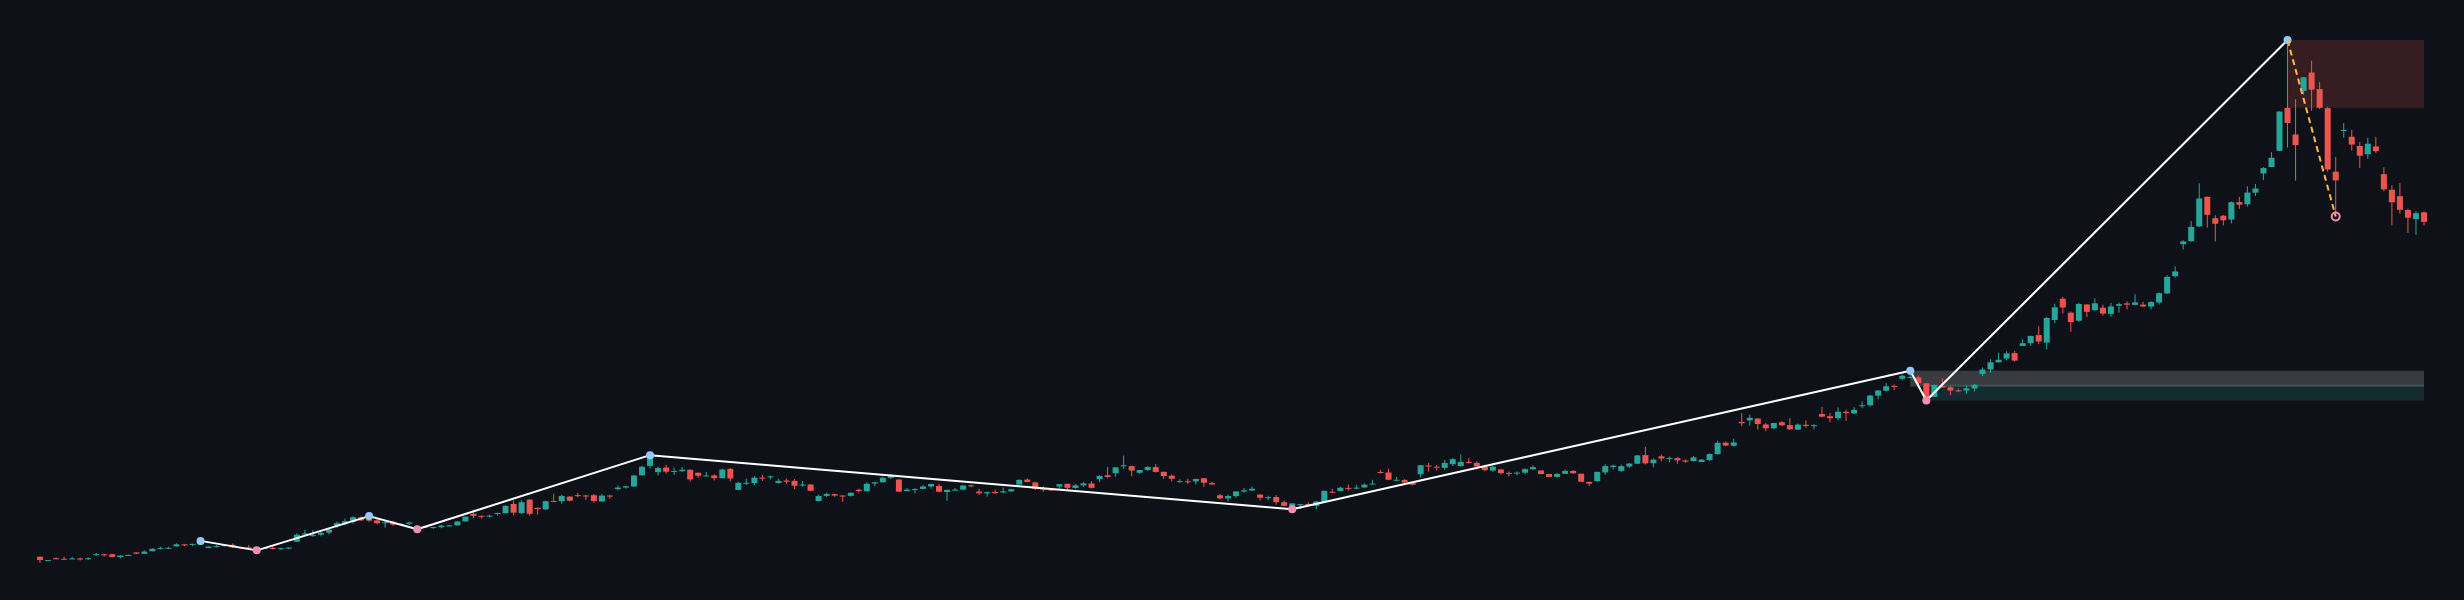
Price is positioned below the Weekly resistance zone at 5019.871–5595.362 and above the major Weekly support zone at 2536.779–2671.694. A second Weekly area at 2655.184–2790.099 is marked as broken-retest support. These zones are distant structural references rather than immediate Daily decision areas. The Weekly ATR is 269.830, reinforcing the scale of the higher-timeframe ranges.
The available report does not provide numerical Weekly moving-average values, so their exact location, spacing, slope, and any crossover are not determinable from the report. The higher timeframe therefore permits further corrective movement while the price remains below the Weekly resistance zone, but it continues to favor the broader bullish framework unless a confirmed structural change develops.
Main-frame structure
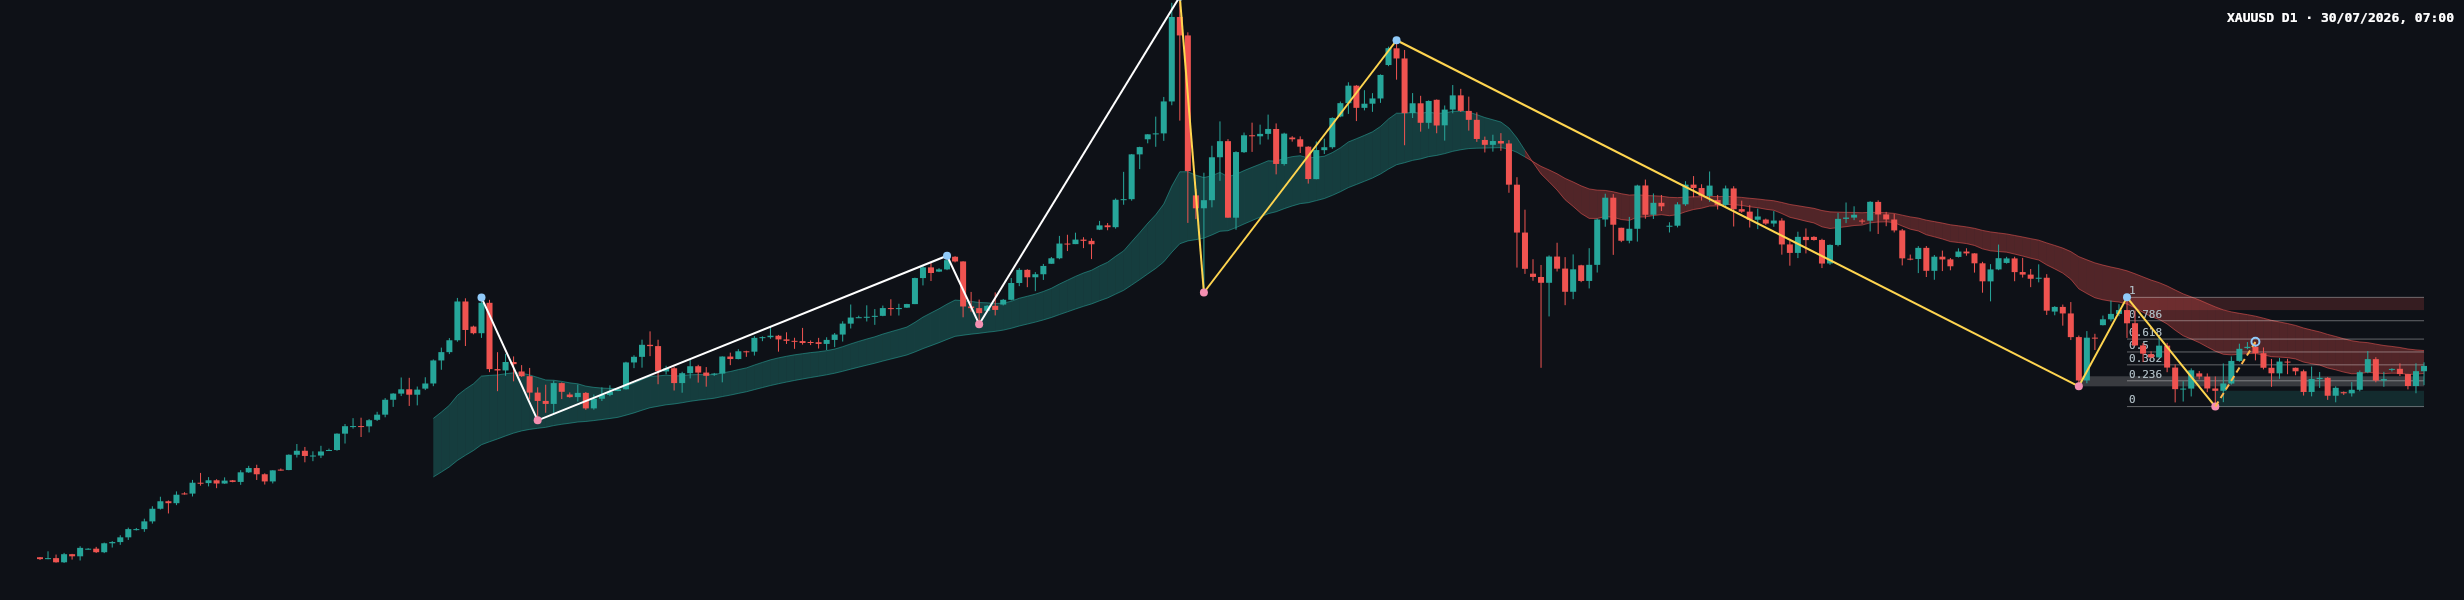
The Daily main trend is firmly down, while the Daily sub-trend is up. This is a direct conflict with the Weekly directional framework: the Daily advance can be read as a recovery inside a larger correction, although sustained strength above the Daily resistance zone could become an early reversal signal. No Daily structure event is reported, so neither a bullish break of structure nor a bearish continuation break is confirmed.
The most recent confirmed Daily swing is a low at 3942.138. The Daily support zone is 3942.138–4005.629, while the broken-retest resistance zone is 4023.812–4064.168. The last Daily close at 4105.933 is above that broken-retest area and close to the Fibonacci 0.382 level at 4110.334. The next marked Daily resistance zone is 4331.294–4382.441.
The latest completed Fibonacci leg runs from 3942.138 to 4382.441. Its marked levels are 0 at 3942.138, 0.236 at 4046.050, 0.382 at 4110.334, 0.5 at 4162.290, 0.618 at 4214.245, 0.786 at 4288.216, and 1 at 4382.441. The current retracement ratio is 0.372, placing the recovery immediately below the 0.382 reference.
The chart shows the recent candles clustering around the lower part of the marked resistance structure after the rebound from 3942.138. Candle bodies appear relatively compact in this consolidation, with alternating bullish and bearish closes and visible wicks. This suggests an unresolved contest: buyers have defended the recovery, but sellers remain active around the Fibonacci area and the overhead supply shown on the Daily chart. Volume and a numerical momentum reading are not included in the report, so confirmation or divergence from those measures is not determinable.
Numerical Daily moving-average values are not supplied. Consequently, the exact position of price relative to the two moving averages, their spacing, slope, and any crossover cannot be stated reliably. The Daily ATR is 80.712, providing a volatility reference for interpreting the size of future candles without implying a fixed expected range.
Key levels
- 3942.138–4005.629: Daily support and the area containing the most recent confirmed swing low.
- 4023.812–4064.168: broken-retest resistance, now below the latest Daily close.
- 4046.050: Fibonacci 0.236.
- 4110.334: Fibonacci 0.382 and the immediate recovery test.
- 4162.290: Fibonacci 0.5.
- 4214.245: Fibonacci 0.618.
- 4288.216: Fibonacci 0.786.
- 4331.294–4382.441: Daily resistance zone and the upper end of the completed Fibonacci leg.
- 5019.871–5595.362: Weekly resistance zone, with 5595.362 also the most recent confirmed Weekly swing high.
Conditional scenarios
Bullish continuation scenario
If price establishes acceptance above 4110.334, the recovery could extend toward 4162.290, then 4214.245 and the wider 4331.294–4382.441 resistance zone. The scenario would lose strength if price falls back below 4046.050; a deeper invalidation reference is the broken-retest zone at 4023.812–4064.168. Probability is not determinable from the supplied report.
Bearish rejection scenario
If the market rejects 4110.334 and returns below 4046.050, sellers could retest 4023.812–4064.168. A move through that area would bring the Daily support zone at 3942.138–4005.629 back into focus. This scenario is invalidated by sustained acceptance above 4110.334, although the broader bearish Daily trend would still need a stronger structural confirmation. Probability is not determinable from the supplied report.
Range and false-break scenario
Price may continue oscillating between the broken-retest area at 4023.812–4064.168 and the Fibonacci references at 4110.334 and 4162.290 without producing a confirmed structure event. A false break above 4110.334 would favor a return toward 4046.050; a false break below 4046.050 would be questioned if price quickly reclaims 4110.334. Probability is not determinable from the supplied report.
Session considerations
The cleanest technical information would come from how Daily closes behave around 4110.334, 4046.050, and 4023.812–4064.168. A sustained close beyond a level followed by a successful retest would provide stronger confirmation than an isolated intraday wick. Traders should also remain alert to false breakouts and liquidity sweeps, particularly when volatility expands toward the Daily ATR of 80.712.
No news or economic-calendar information is supplied with the report. DXY, US ten-year yields, CPI, NFP, FOMC communication, Fed speakers, and geopolitical headlines are therefore external considerations rather than confirmed catalysts in this analysis. Asian, European, and US sessions can produce different liquidity and volatility conditions in gold, but the report does not provide session-specific statistics or an exact event time window.
Summary
- The Weekly trend is firmly up, with a confirmed swing high at 5595.362 and no reported structure event.
- The Daily trend is firmly down, although the sub-trend is up after the swing low at 3942.138.
- The immediate decision point is Fibonacci 0.382 at 4110.334.
- Support is concentrated at 3942.138–4005.629; overhead Daily resistance is 4331.294–4382.441.
- The current retracement ratio is 0.372, leaving the recovery just below the 0.382 reference.
The single most important factor today is whether price can sustain acceptance above 4110.334 or instead rejects that level and rotates back toward 4046.050 and 4023.812–4064.168.
Risk disclaimer: This article is technical analysis and reference information only, not investment advice. Markets carry risk, and readers are responsible for their own decisions.
Hashtags: #XAUUSD #GoldAnalysis #PriceAction #ForexTrading #TechnicalAnalysis
Meta description: XAU/USD Daily analysis: gold tests 4110.334 as Weekly and Daily trends diverge, with key support and resistance zones in focus.