
GBPUSD has weakened on the daily chart, with the last closed price at 1.32376 below the 1.32730–1.33013 support zone. The daily structure has turned more cautious after a change of character, while the weekly chart still shows a firm downtrend with an upward sub-trend. Whether price can reclaim the broken daily area is the immediate technical question.
Higher-timeframe context
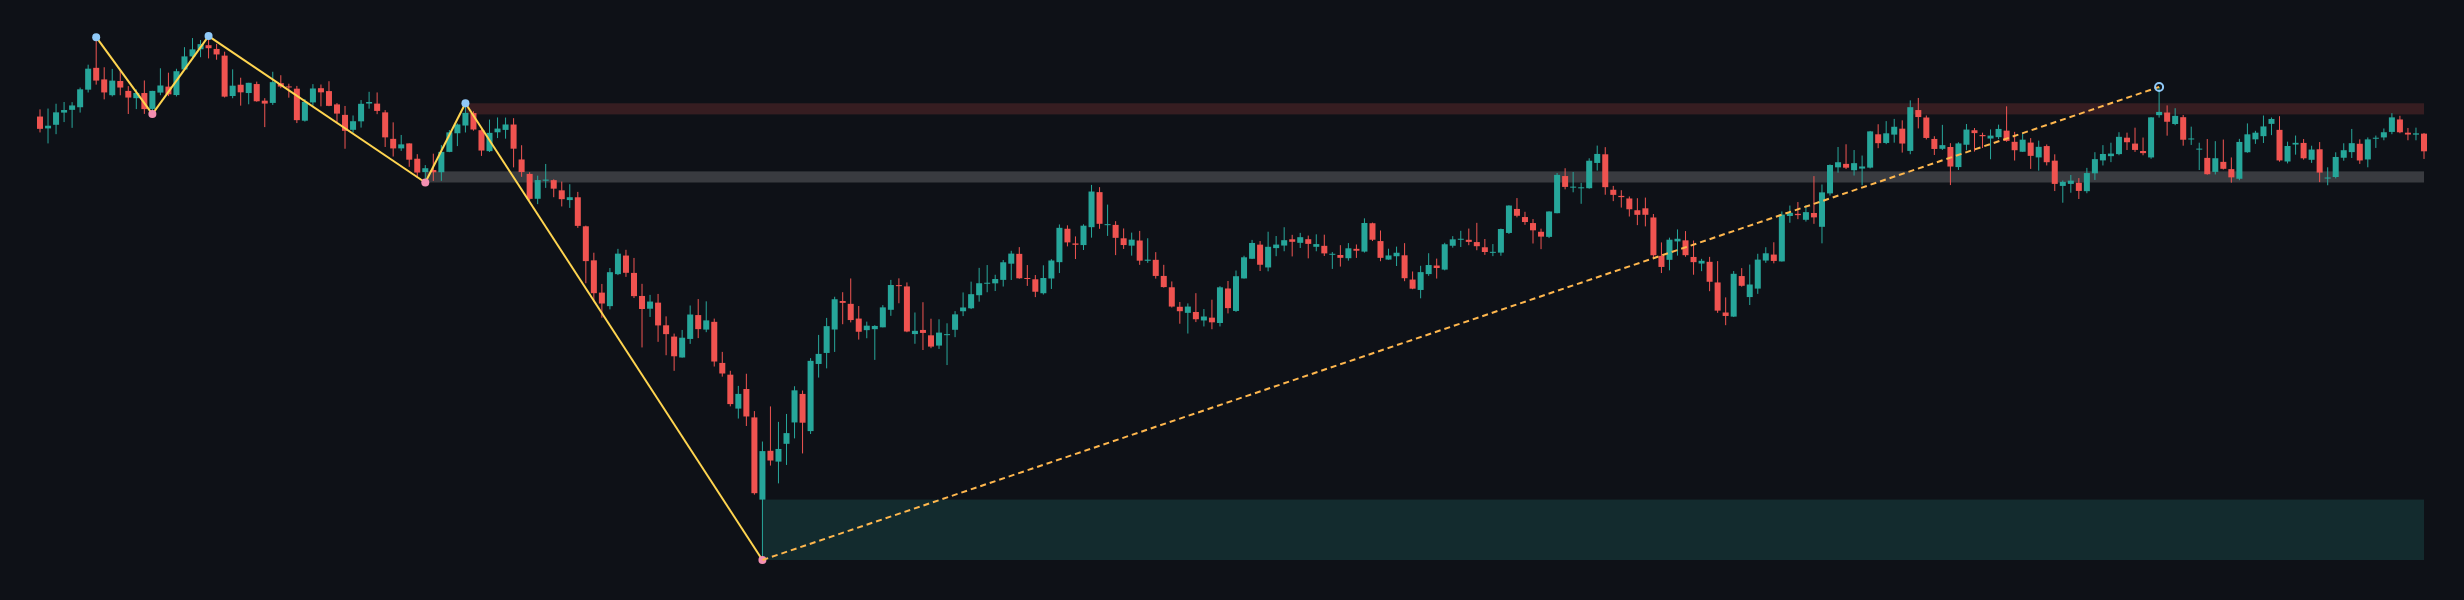
The weekly trend is down, with an upward sub-trend. The latest confirmed weekly swing is a low at 1.03535; the report identifies no new weekly structure event. Price is above the weekly broken-retest zone at 1.31602–1.32425, an area that may now matter as a former resistance region. The broader weekly resistance zone is 1.36664–1.37487, while the marked weekly support zone is 1.03535–1.08025.
On the weekly view, the higher-timeframe downtrend remains the dominant backdrop, but the upward sub-trend and price above the broken-retest zone leave room for continued recovery. A sustained move back beneath that area would weaken the recovery case; the chart report does not specify a weekly Fibonacci reading.
Main-frame structure
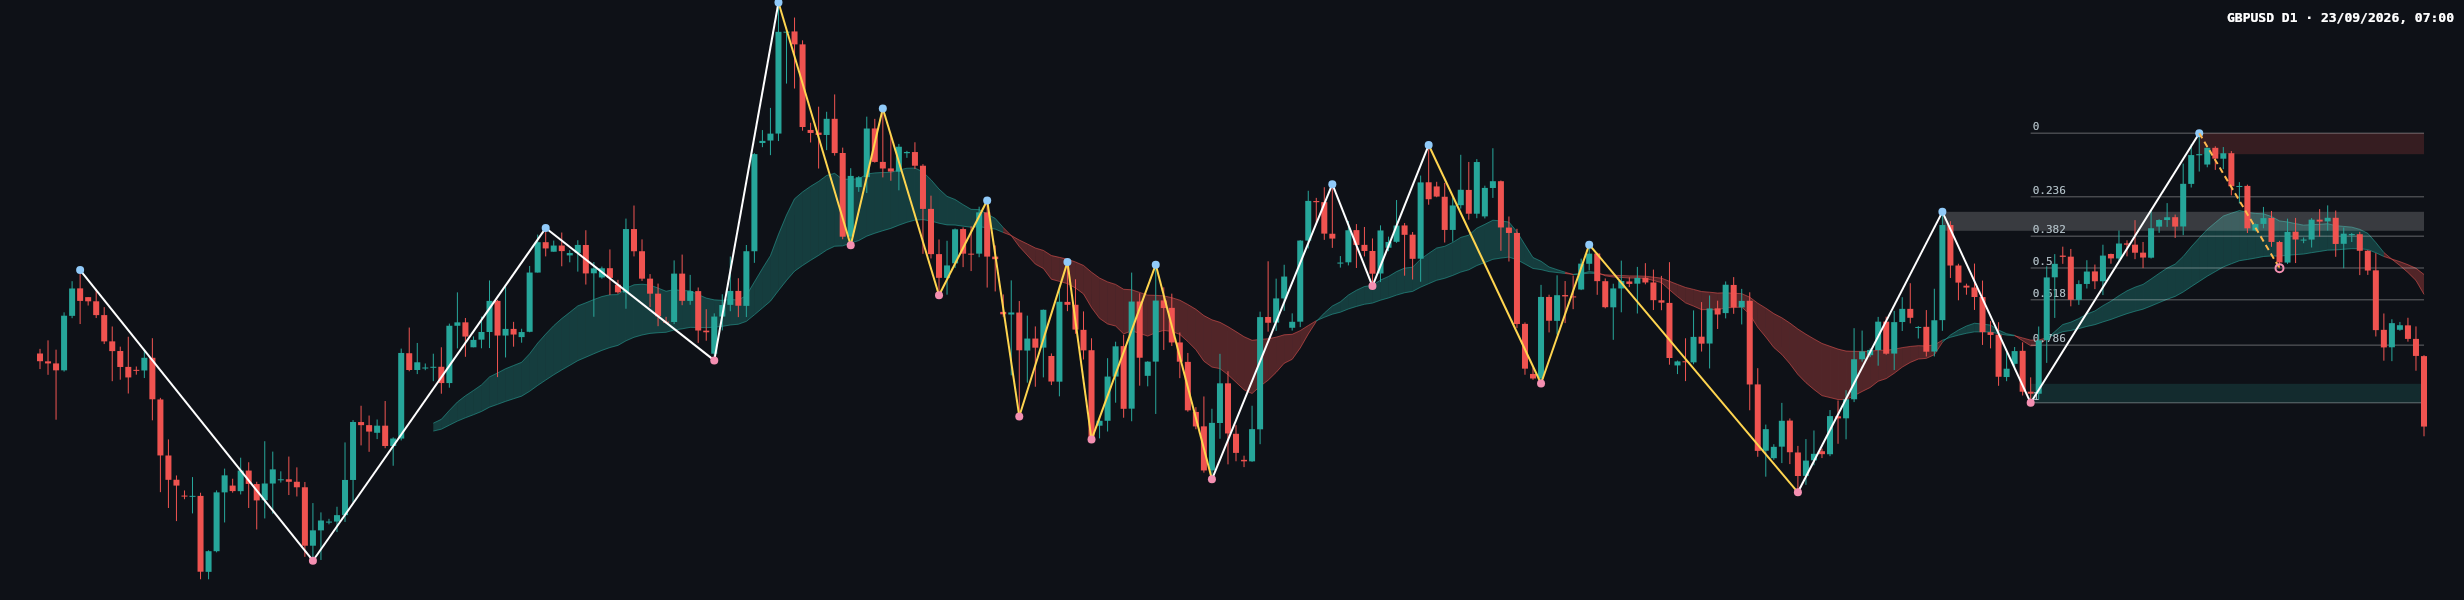
The daily main trend is up but shaky, while the sub-trend is down. A daily change of character is recorded at 1.32730. The latest close, 1.32376, sits below the daily support zone at 1.32730–1.33013, so the market has not yet demonstrated a recovery of that area.
The latest completed Dow leg has retraced to a ratio of 1.000, with the corresponding level at 1.32730. The other reported Fibonacci references are 1.33591, 1.34267, 1.34742, 1.35217, 1.35804 and 1.36754. The current close is below the leg’s 1.32730 endpoint, making recovery of the broken level an important condition for a more constructive daily reading.
The chart’s latest visible candles show renewed selling into the right edge, consistent with the reported daily sub-trend. The supplied data does not quantify candle ranges or provide volume, so neither candle-by-candle comparisons nor volume confirmation can be established from the report.
Key levels
- 1.32730–1.33013: daily support zone, now overhead relative to the last close.
- 1.32730: broken daily structure level and the 1.000 Fibonacci reference.
- 1.33591–1.34267: Fibonacci references above the current price.
- 1.35297–1.35580: daily broken-retest support zone, above the current price.
- 1.36441–1.36754: daily resistance zone; 1.36754 is also the latest confirmed daily swing high.
- 1.31602–1.32425: weekly broken-retest zone below the current close, and a relevant lower reference if daily weakness persists.
Scenarios
Bullish recovery
If price reclaims and holds above 1.32730–1.33013, the immediate breakdown would be less convincing. The next reported Fibonacci references above are 1.33591–1.34267. A move back below 1.32730 would undermine this recovery scenario.
Bearish continuation
If price remains below 1.32730–1.33013 and selling continues, the daily sub-trend would remain aligned with the recent structure break. The weekly broken-retest zone at 1.31602–1.32425 is the next marked lower area in the supplied levels. A sustained reclaim of 1.33013 would weaken this scenario.
Range or indecision
If price moves around the broken daily area without a sustained reclaim or further rejection, the chart may remain unsettled. The key test is whether the market can hold above 1.32730–1.33013 or continues to treat it as resistance; a clear move beyond that zone would reduce the case for a narrow, indecisive response.
Overall, the daily picture leans cautious while price remains below 1.32730–1.33013, although the weekly recovery sub-trend means a successful reclaim would materially change the near-term read. These are conditional technical scenarios, not predictions.
This analysis is for informational purposes only and is not investment advice. Markets carry risk, and readers are responsible for their own decisions.