
GBPUSD closed at 1.33815 on the daily frame, with price pulling back from the confirmed swing high at 1.36754. The broader weekly trend remains down, while the daily trend remains up, creating a counter-trend tension around the daily support at 1.32730–1.32994 and the broken-retest zone at 1.35316–1.35580.
| Metric | Reading |
|---|---|
| Most recent close | 1.33815 |
| Weekly trend | Down, firm |
| Daily trend | Up, firm, with a down sub-trend |
| Nearest daily resistance | 1.35316–1.35580 |
| Nearest daily support | 1.32730–1.32994 |
| Active Fibonacci area | Between 0.786 at 1.33591 and 0.618 at 1.34267 |
| Daily ATR | 0.00527 |
Higher-timeframe context
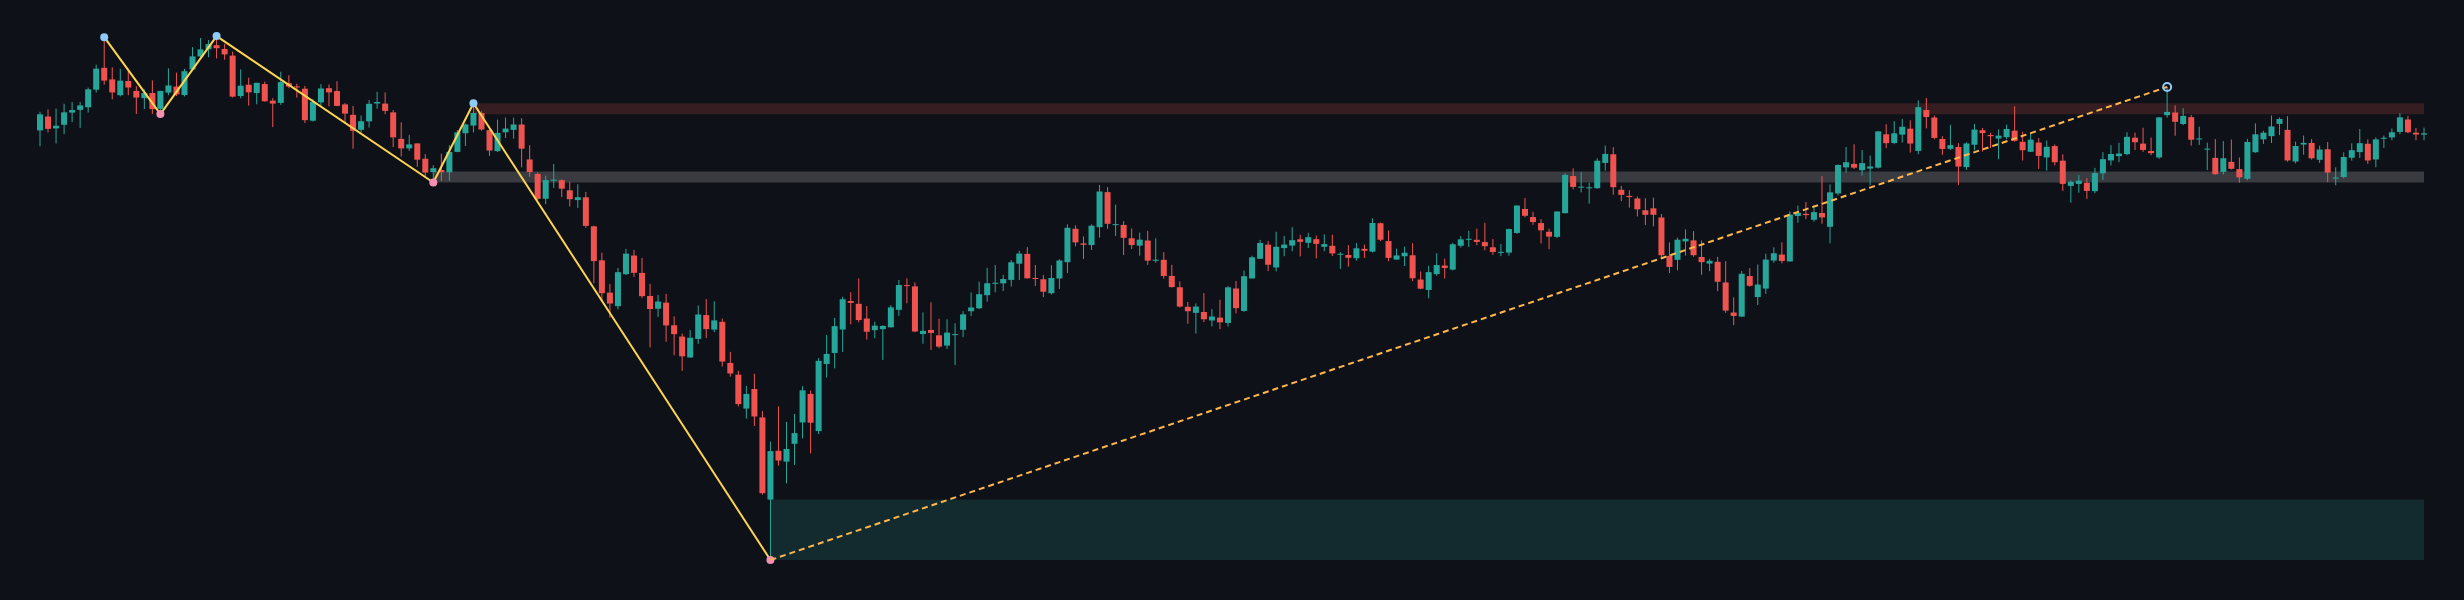
The weekly structure is classified as a firm downtrend, although the sub-trend is up. No weekly structure event is recorded, so the recent recovery has not yet established a confirmed change in the dominant direction. The most recent confirmed weekly swing is the low at 1.03535.
Weekly price is below the resistance zone at 1.36675–1.37487 and above the broader support zone at 1.03535–1.08025. The former weekly broken-retest zone is 1.31602–1.32414. Relative to the latest weekly close of 1.35254, the market is positioned above that former support area but still beneath the higher resistance band.
The weekly ATR is 0.01624, which places the weekly context around a wide potential movement envelope. The weekly picture permits further recovery while price holds above the lower structural areas, but it still favors caution toward the upside because the dominant trend remains down and the resistance zone at 1.36675–1.37487 has not been overcome.
Main-frame structure
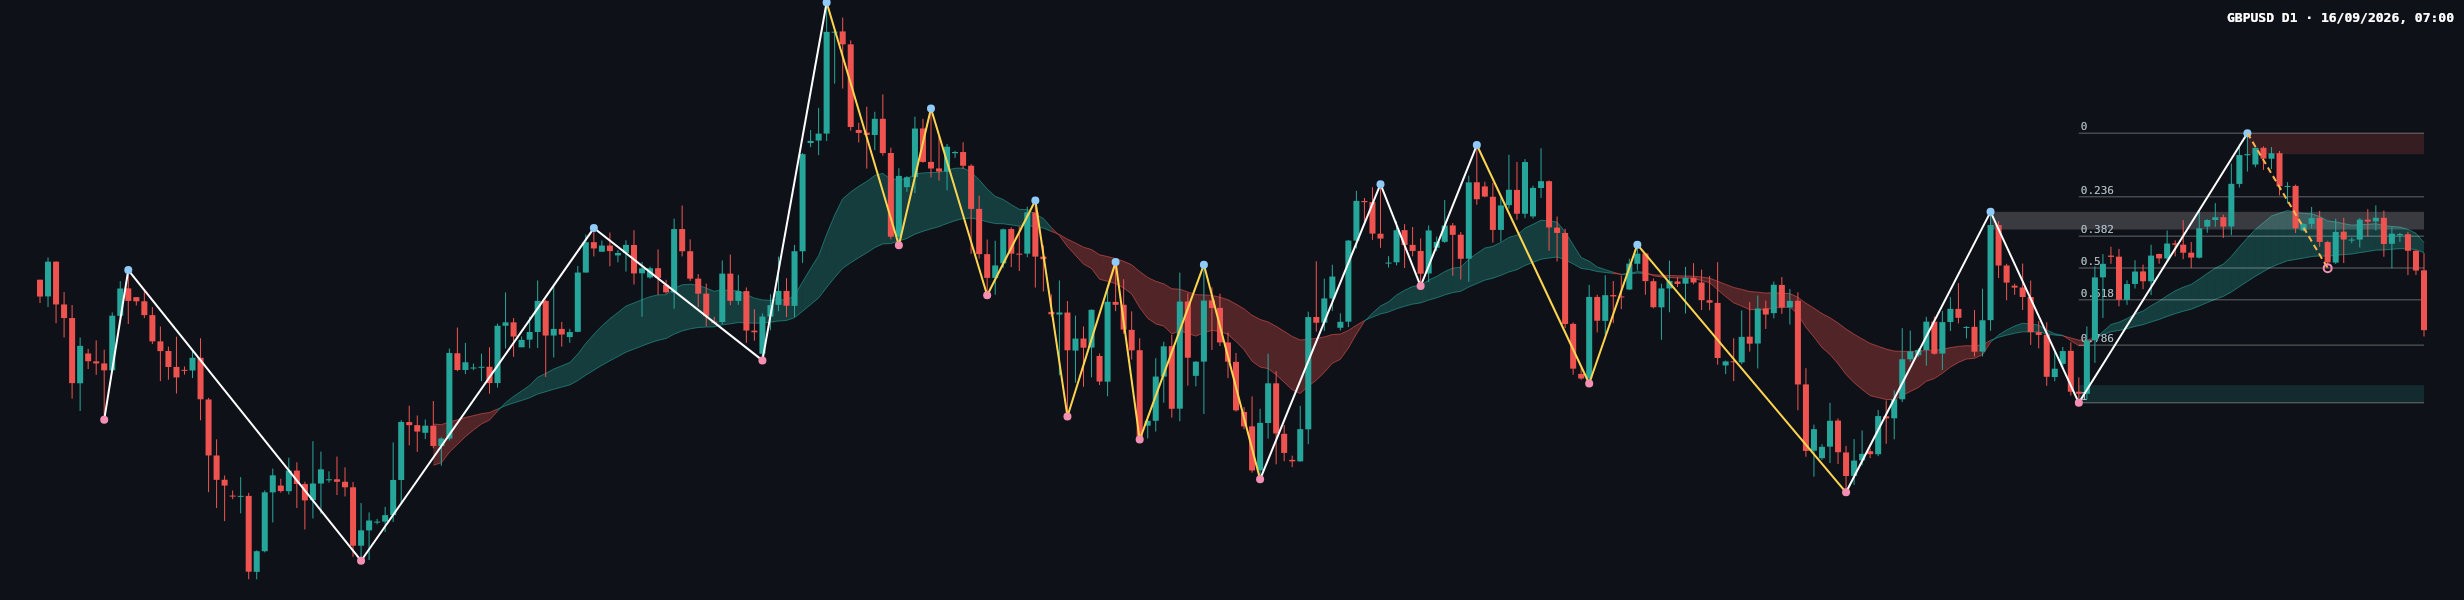
The daily frame carries a firm uptrend, but its sub-trend is down. This is a misalignment with the weekly chart: the daily decline can be read as a pullback within the larger recovery, while sustained weakness through daily support would increase the risk that the weekly downtrend is reasserting itself.
The latest confirmed daily swing high is 1.36754. The daily resistance zone is 1.36441–1.36754, while the key support zone is 1.32730–1.32994. The broken-retest zone at 1.35316–1.35580 now sits above the latest close and is therefore an important test for any attempted recovery. No daily structure event is recorded.
The latest completed Dow leg has Fibonacci levels at 0: 1.36754, 0.236: 1.35804, 0.382: 1.35217, 0.5: 1.34742, 0.618: 1.34267, 0.786: 1.33591, and 1: 1.32730. The current retracement ratio is 0.730. With the close at 1.33815, price is above 1.33591 but below 1.34267, leaving the market in a middle retracement area rather than at a clear extreme.
The chart shows moving-average ribbons, but exact moving-average values, spacing and crossover readings are not provided in the deterministic report. Those details are therefore not determinable numerically. The visible price action nevertheless shows a pullback from 1.36754 toward the lower Fibonacci region.
Key levels and market reading
- 1.36441–1.36754: daily resistance and the area surrounding the confirmed swing high.
- 1.36675–1.37487: weekly resistance and the main higher-timeframe supply area.
- 1.35316–1.35580: daily broken-retest zone and the first recovery test above the current close.
- 1.35217: daily Fibonacci level at the 0.382 retracement.
- 1.34742: daily Fibonacci midpoint.
- 1.34267: daily Fibonacci level at the 0.618 retracement.
- 1.33591: daily Fibonacci level at the 0.786 retracement.
- 1.32730–1.32994: principal daily support zone.
- 1.31602–1.32414: weekly broken-retest area beneath the principal daily support.
The most important structural question is whether the close at 1.33815 develops into a hold above 1.33591 and a recovery toward 1.34267, or whether sellers extend the decline toward 1.32730–1.32994. The area between 1.35316–1.35580 and 1.36441–1.36754 would need to be reclaimed before the daily uptrend could regain clearer control.
Conditional scenarios
Primary scenario: recovery from the lower Fibonacci area
If price holds above 1.33591 and recovers through 1.34267, the next reference areas are 1.34742, 1.35217 and the broken-retest zone at 1.35316–1.35580. A sustained move through that zone would improve the daily recovery case and bring 1.36441–1.36754 back into focus. This scenario is invalidated by sustained acceptance below 1.32730–1.32994. Its relative probability is not quantified in the report.
Secondary scenario: continuation toward daily support
If price remains below 1.34267 and breaks beneath 1.33591, the decline can expose 1.32730–1.32994. A break of that support would place the weekly broken-retest zone at 1.31602–1.32414 into focus. This scenario is invalidated by a recovery above 1.35316–1.35580. Its relative probability is not quantified in the report.
Risk scenario: broader upside challenge
If buyers reclaim 1.35316–1.35580 and then clear 1.36441–1.36754, the weekly resistance band at 1.36675–1.37487 becomes the relevant higher-timeframe test. Rejection from that band would preserve the weekly downtrend. This scenario is invalidated by a renewed move below 1.33591. Its relative probability is not quantified in the report.
Closing assessment
GBPUSD is at a decision point between a daily pullback and a deeper continuation of the weekly downtrend. The close at 1.33815 is above the daily support zone but below the broken-retest resistance, while the 0.730 retracement reading places emphasis on the response around 1.33591 and 1.34267. A recovery through 1.35316–1.35580 would strengthen the daily case; weakness through 1.32730–1.32994 would favor the broader bearish structure.
SEO summary: GBPUSD analysis covering the weekly downtrend, daily pullback, Fibonacci levels, support at 1.32730–1.32994 and resistance at 1.35316–1.35580.
#GBPUSD #ForexAnalysis #PriceAction #DowTheory #TechnicalAnalysis
This article is technical analysis and reference information only, not investment advice. Markets carry risk, and readers are responsible for their own decisions.