
GBPUSD is trading at a significant multi-timeframe decision area. The latest closed price is 1.34825: the daily trend remains firmly up, while the weekly trend remains firmly down. On the daily chart, the recent decline is unfolding after a confirmed swing high at 1.36754, with Fibonacci reference points and nearby support now defining the balance between a continuation of the broader recovery and a deeper retracement.
| Metric | Reading |
|---|---|
| Latest closed price | 1.34825 |
| Weekly trend | Down, with an upward sub-trend |
| Daily trend | Up, with a downward sub-trend |
| Nearest daily resistance | 1.35336–1.35580 broken-retest zone |
| Nearest daily support | 1.32730–1.32974 |
| Active Fibonacci reference | 0.5 at 1.34742; current retracement ratio 0.479 |
| Daily ATR | 0.00488 |
Higher-timeframe context
The weekly main trend is down and described as firm, although the sub-trend is up. The most recent confirmed weekly swing is a low at 1.03535, and no weekly structure event is recorded. This combination allows for continued corrective strength, but it does not yet establish a confirmed higher-timeframe reversal.
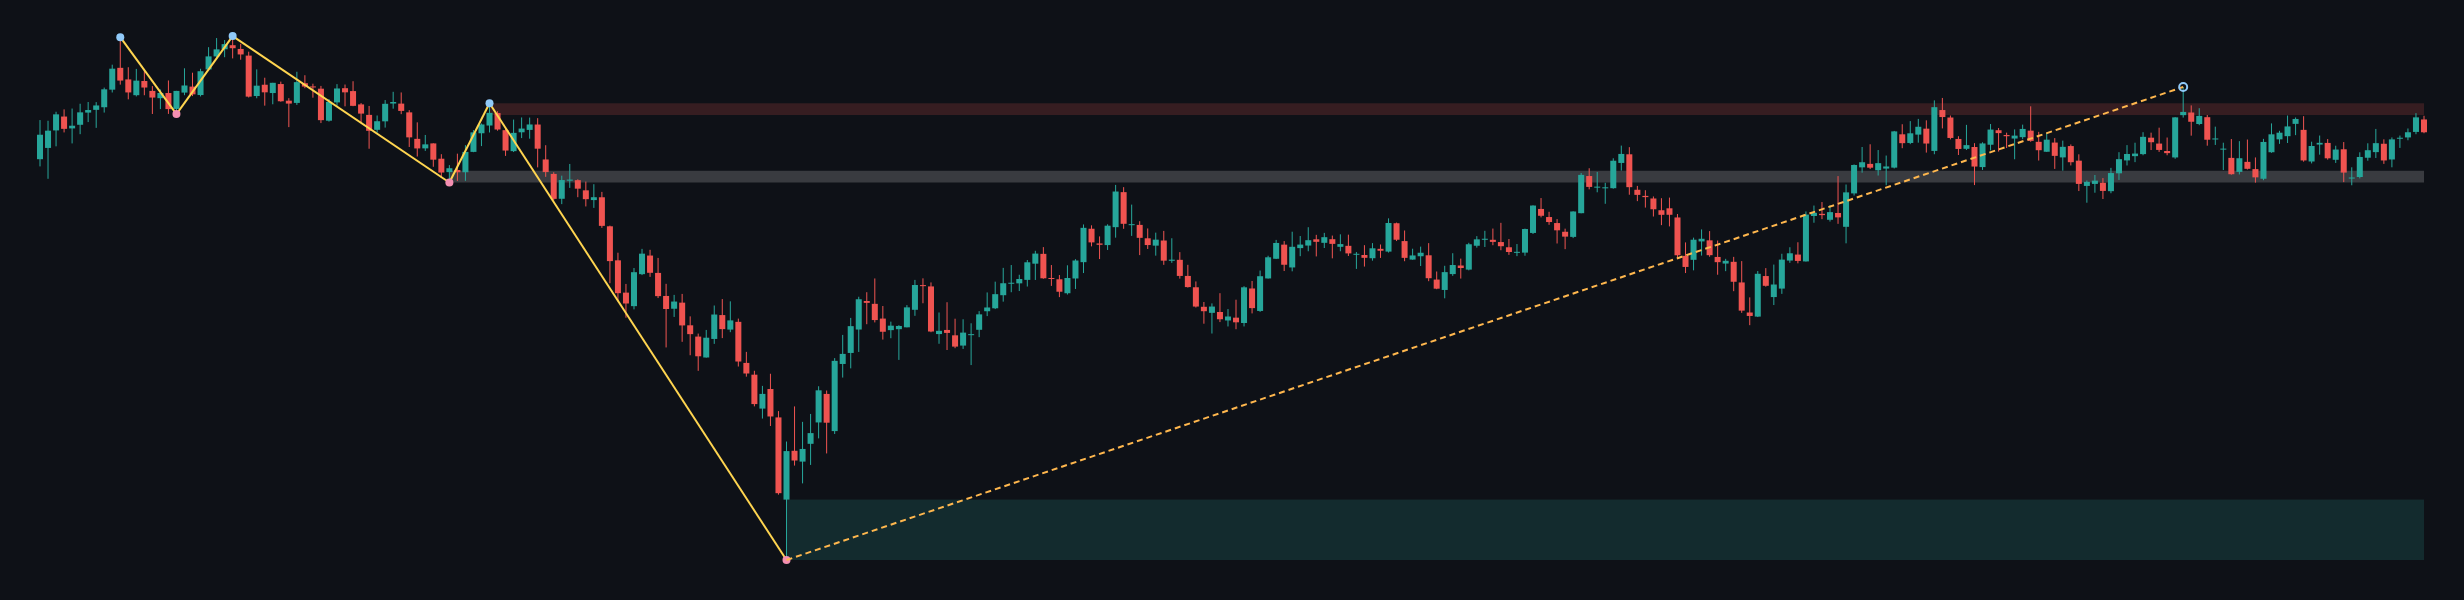
Price is below the major weekly resistance zone at 1.36619–1.37487. A second weekly reference is the broken-retest zone at 1.31602–1.32470, while the broad weekly support zone is 1.03535–1.08025. The weekly ATR is 0.01736, highlighting a considerably wider contextual range than the daily ATR.
The weekly chart therefore permits further upside toward the resistance area, but the firm weekly downtrend means that rallies into 1.36619–1.37487 may face substantial supply. Conversely, sustained acceptance above that zone would be a materially stronger sign that the upward sub-trend is becoming more influential.
Main-frame structure
The daily main trend is up, while the sub-trend is down. This is currently better described as a pullback within the daily recovery than as a confirmed reversal, because no daily structure event is recorded. The latest confirmed daily swing high is 1.36754, which also marks the zero Fibonacci reference.
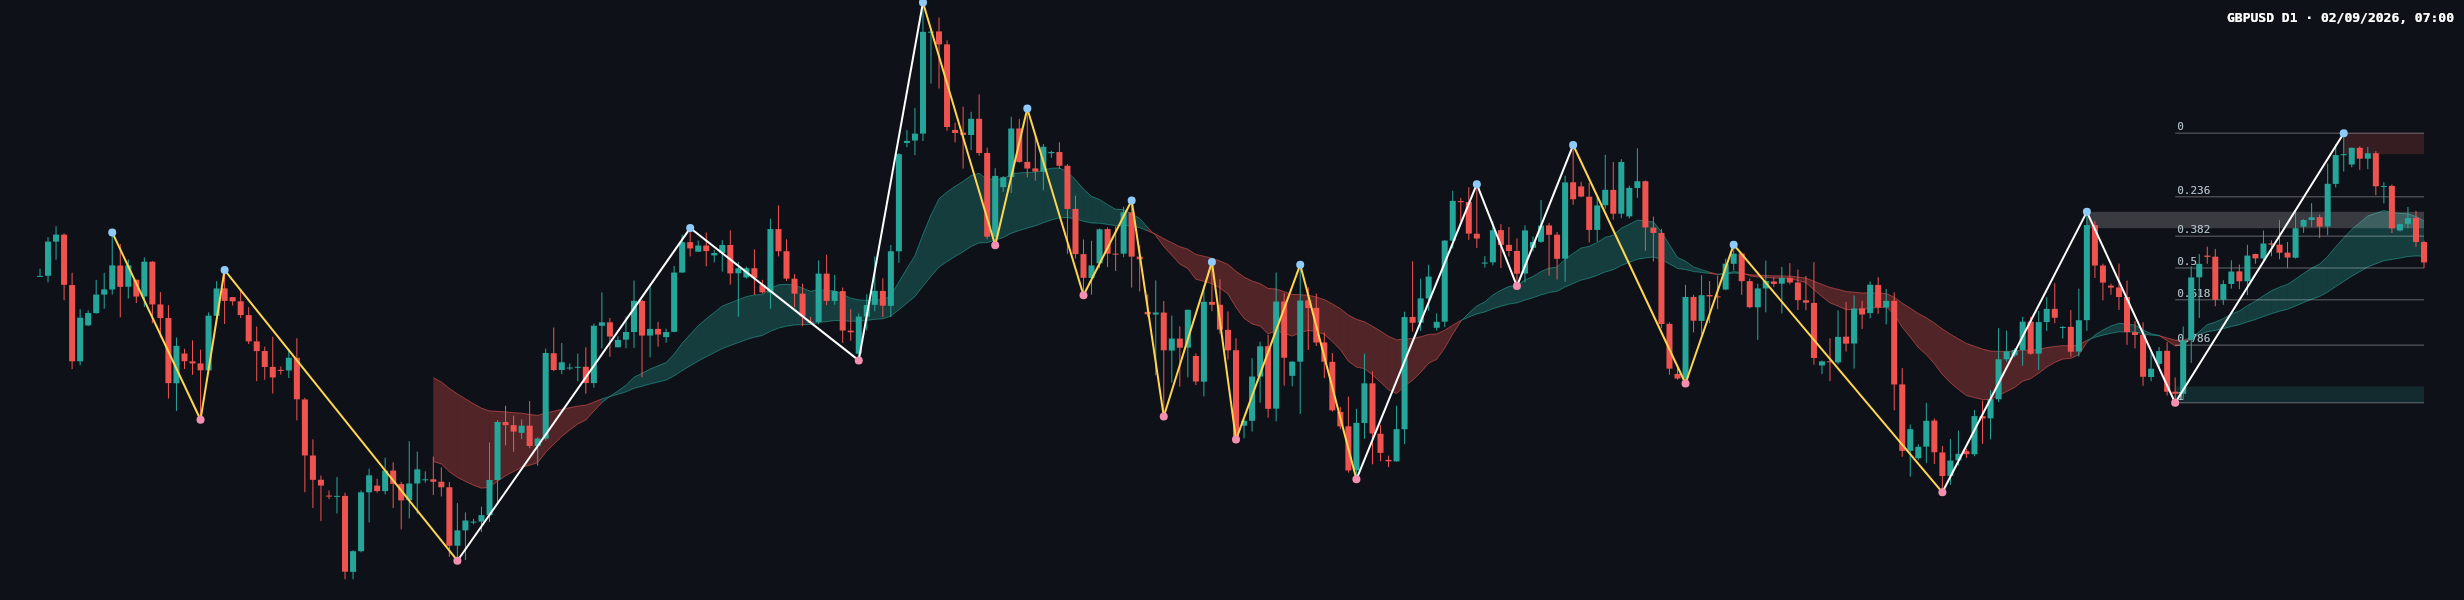
The latest completed Dow leg runs from 1.36754 to 1.32730. Its Fibonacci levels are 0.236 at 1.35804, 0.382 at 1.35217, 0.5 at 1.34742, 0.618 at 1.34267, 0.786 at 1.33591, and 1 at 1.32730. The current retracement ratio is 0.479, placing price close to the midpoint of that leg.
The daily moving-average values are not included in the deterministic report, so their exact levels, spacing, slope, and crossover status are not determinable here. The visible moving-average envelope should therefore be treated as secondary confirmation rather than as a basis for introducing unreported levels.
Key levels and recent price action
- 1.36441–1.36754: daily resistance, with 1.36754 also the latest confirmed swing high.
- 1.36619–1.37487: major weekly resistance zone.
- 1.35336–1.35580: daily broken-retest resistance and an important recovery checkpoint.
- 1.35217: daily 0.382 Fibonacci level.
- 1.34742: daily 0.5 Fibonacci level, close to the latest closed price.
- 1.34267: daily 0.618 Fibonacci level.
- 1.33591: daily 0.786 Fibonacci level.
- 1.32730–1.32974: daily support area, with 1.32730 the completed-leg endpoint.
- 1.31602–1.32470: weekly broken-retest support zone.
The recent candles show a retreat from the area around the confirmed high at 1.36754. Price has moved through the upper Fibonacci references and is now testing the midpoint area around 1.34742. The exact candle classifications, body-to-wick proportions, and range comparisons are not determinable from the deterministic report. Nonetheless, the closing location near the midpoint of the completed leg indicates that neither the daily buyers nor sellers have yet produced a recorded structure event.
Conditional scenarios
Primary scenario: support holds and the daily recovery resumes
If price stabilizes around 1.34742 and reclaims the 1.35217 to 1.35336–1.35580 area, the daily uptrend would regain clearer control. The next resistance references would be 1.35804 and then 1.36441–1.36754. This scenario would be weakened if price accepts below 1.34267. Its probability is not determinable from the available report.
Secondary scenario: range formation around the Fibonacci midpoint
If price remains between the midpoint reference at 1.34742 and the broken-retest zone at 1.35336–1.35580, the market may continue consolidating while the conflicting weekly and daily trends remain unresolved. A sustained move below 1.34267 would invalidate this range-based interpretation and shift attention toward 1.33591. Its probability is not determinable from the available report.
Risk scenario: deeper daily retracement
If 1.34267 fails to hold, the next Fibonacci references are 1.33591 and the support zone at 1.32730–1.32974. A decline into that area would represent a deeper correction of the daily recovery and would bring the broader weekly broken-retest zone at 1.31602–1.32470 back into focus. A recovery back above 1.35336–1.35580 would challenge this bearish interpretation. Its probability is not determinable from the available report.
What to monitor
The most informative observations are acceptance or rejection around 1.34742, the response at 1.34267, and whether price can reclaim 1.35336–1.35580. Above that zone, attention turns to 1.35804 and the resistance band at 1.36441–1.36754. Below 1.34267, the deeper support references are 1.33591 and 1.32730–1.32974.
False breaks are possible around both the Fibonacci midpoint and the broken-retest zone. A close beyond a level followed by a successful retest would provide stronger confirmation than a brief intraday probe. The available report contains no news schedule or exact event time, so upcoming economic-calendar risks are not determinable from the supplied data. General risk controls remain important, including avoiding excessive exposure and allowing for volatility around major releases.
Conclusion
- The weekly trend is firmly down, but its sub-trend is up.
- The daily trend is firmly up, with the current sub-trend down and no recorded structure event.
- 1.34742 is the central Fibonacci reference near the latest close.
- Recovery strength would need to reclaim 1.35336–1.35580 before the higher resistance levels become relevant.
- A break below 1.34267 would expose 1.33591 and 1.32730–1.32974.
The single most important issue is whether price can defend 1.34742 while the daily recovery remains below the weekly resistance framework.
#GBPUSD #Forex #PriceAction #DowTheory #TechnicalAnalysis
Meta description: GBPUSD analysis covering weekly resistance, daily Fibonacci support, structure, and conditional bullish and bearish scenarios.
This article is technical analysis and reference information only, not investment advice. Markets carry risk, and readers are responsible for their own decisions.