
BTCUSD’s daily chart retains a firm uptrend, while its shorter-term sub-trend is down and price is consolidating near a retracement level. The latest daily close is below the 0.382 Fibonacci level, with a retest support zone beneath price and a defined resistance zone overhead. The weekly backdrop remains a firm downtrend, so a daily recovery would still face higher-timeframe resistance.
Higher-timeframe context — weekly
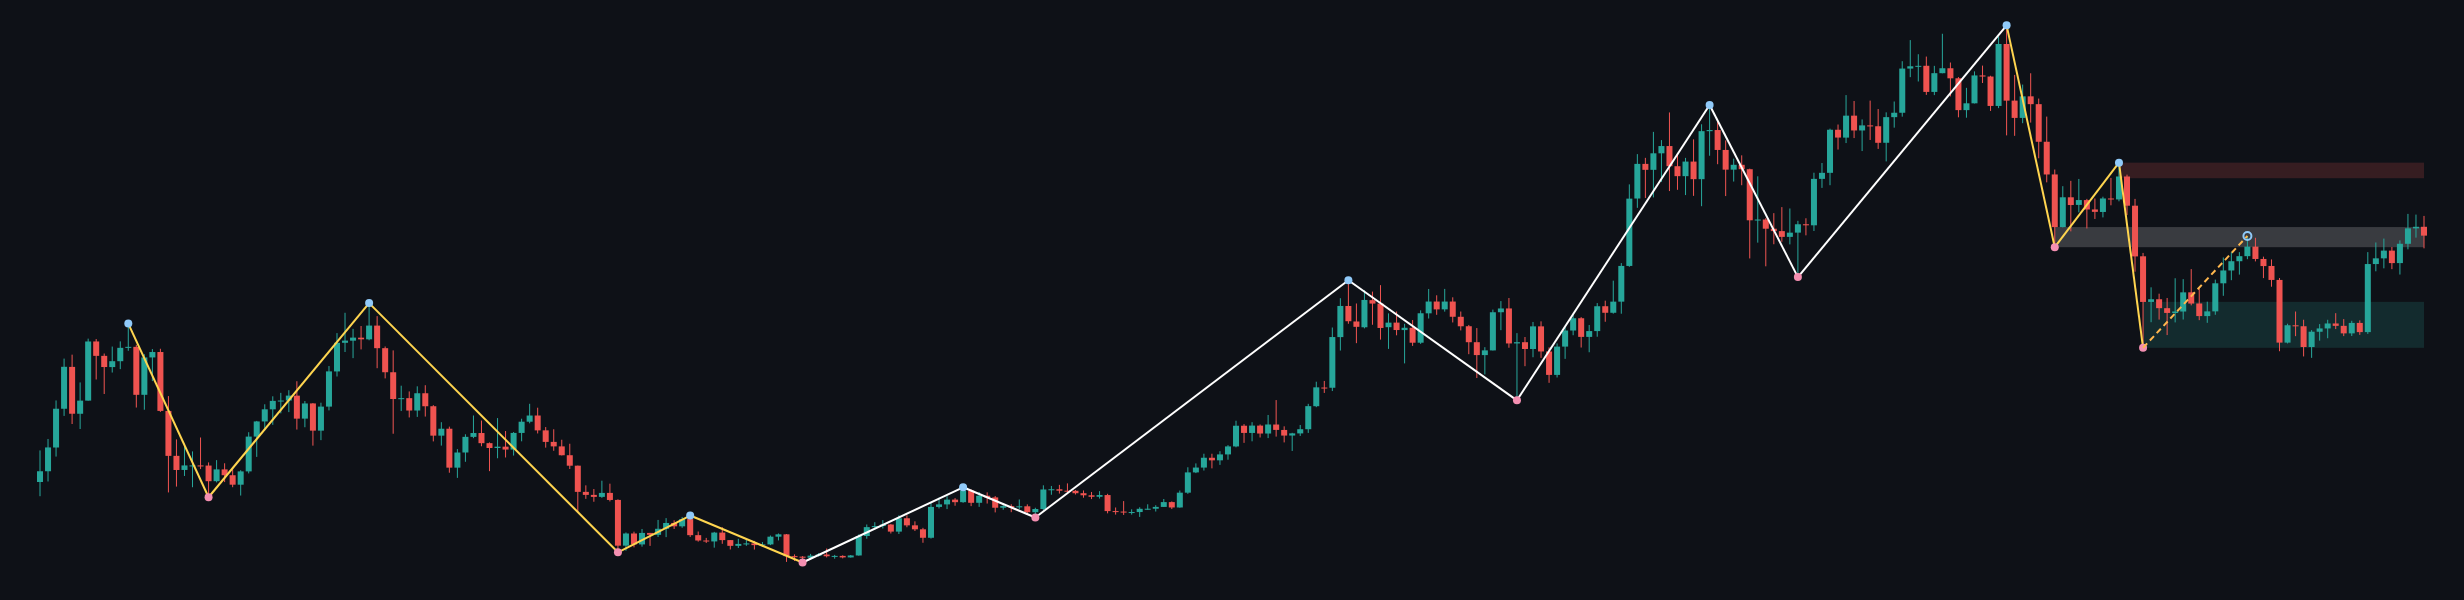
The weekly trend is down, with an upward sub-trend. The latest confirmed weekly swing is the low at 59783.75, and the report identifies no new structure event. The weekly close at 82920.48 is within the broken-retest zone at 80538.63–84683.30, making this area an important test of whether former resistance can continue to act as support.
Further weekly resistance is at 94772.62–97971.19, while the broader support zone is 59783.75–69241.82. The weekly data supplied does not include Fibonacci levels or moving-average readings, so those indicators cannot be assessed here. The higher timeframe permits a recovery while price holds the retest area, but its firm downtrend makes the larger directional backdrop cautious.
Main-frame structure — daily
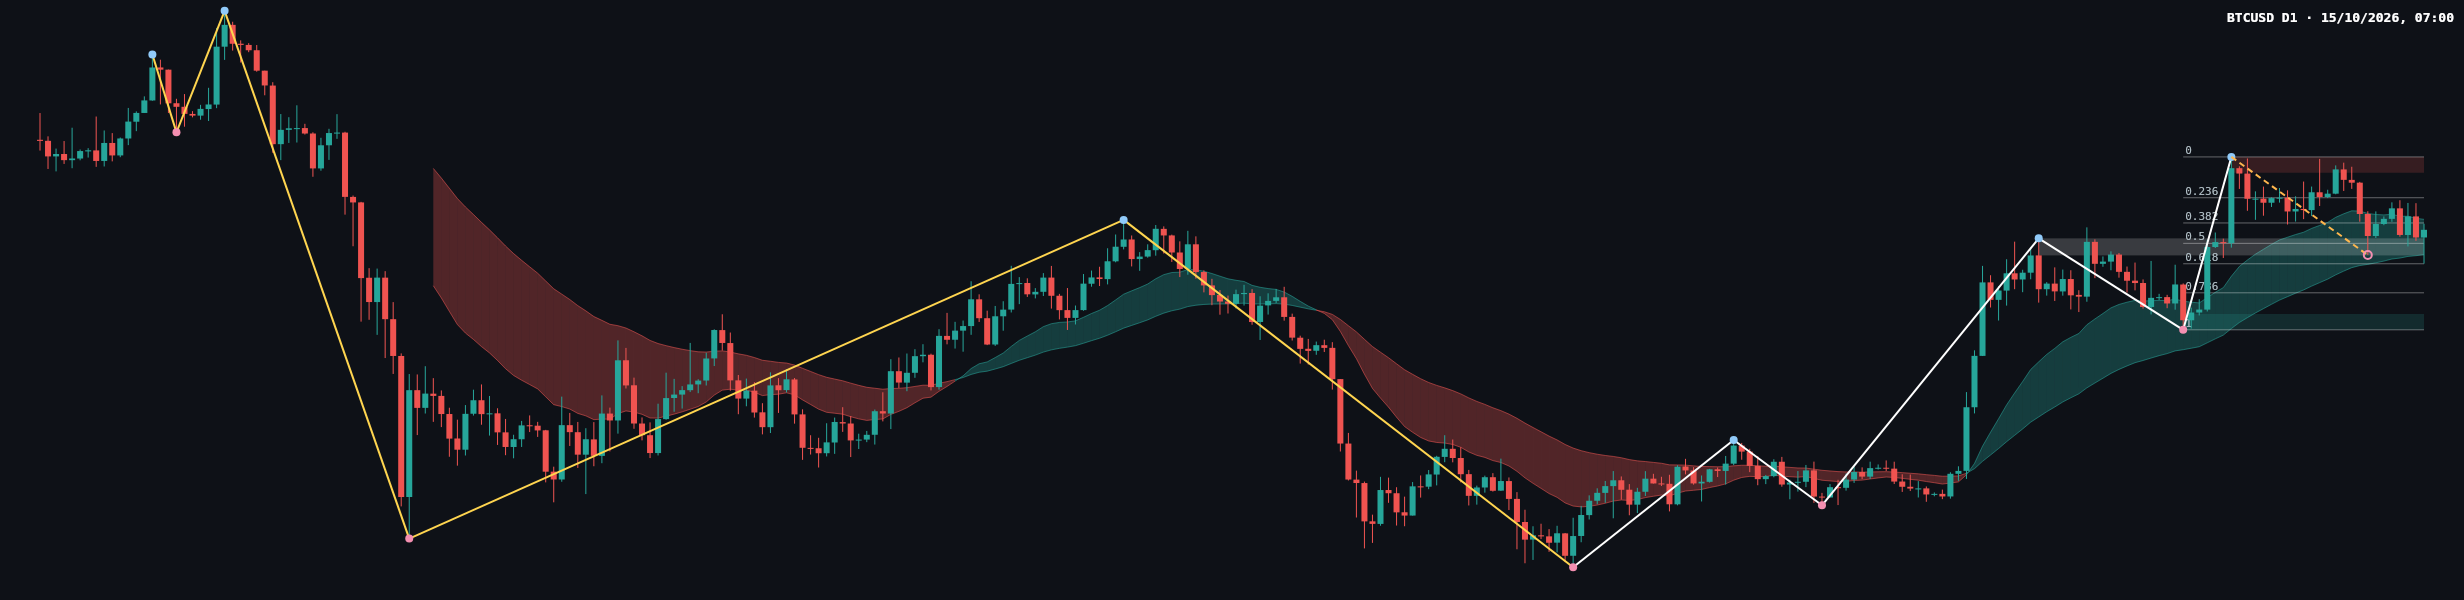
The daily trend is firmly up, but the daily sub-trend is down, so the two timeframes are not aligned. This is consistent with a pullback within the daily advance; the report does not identify a confirmed structure break. The latest confirmed daily swing is the high at 87401.93.
The daily close at 82127.24 is above the broken-retest support zone at 80277.00–81509.20. It is below the Fibonacci 0.382 level at 82623.23, while the reported current retracement ratio is 0.422. This places price near a decision area: reclaiming the Fibonacci level could help the recovery, while loss of the retest support would weaken the current structure. The report provides no daily moving-average values or volume readings, so neither can be used as confirmation.
The annotated chart shows a strong advance from the recent base, followed by a pullback and sideways action near the latest levels. Exact candle statistics and a reliable classification of the closing candle are not included in the data report; the assessment here therefore focuses on the reported close, zones, and structure rather than assigning a candle pattern.
Key levels
- Daily resistance: 86258.51–87401.93.
- Weekly resistance / broken-retest area: 80538.63–84683.30.
- Daily broken-retest support: 80277.00–81509.20.
- Lower daily support: 74892.24–76035.66.
- Weekly support: 59783.75–69241.82.
- Higher weekly resistance: 94772.62–97971.19.
For the latest completed daily Fibonacci leg, the listed levels are 0.236 at 84449.64, 0.382 at 82623.23, 0.5 at 81147.08, 0.618 at 79670.94, 0.786 at 77569.31, and 1 at 74892.24, with 0 at 87401.93. The latest close is below the 0.382 level and above the daily retest support zone.
Scenarios
- Bullish: A sustained move above the daily resistance zone at 86258.51–87401.93 would strengthen the recovery case. The next reported higher-timeframe resistance is 94772.62–97971.19. A return below the daily broken-retest support zone at 80277.00–81509.20 would undermine this scenario.
- Bearish: A decisive move below 80277.00–81509.20 would weaken the daily structure and put the lower support zone at 74892.24–76035.66 in focus. A recovery through 86258.51–87401.93 would invalidate this near-term bearish reading.
- Range-bound: If price remains between the daily broken-retest support at 80277.00–81509.20 and resistance at 86258.51–87401.93, consolidation remains the more appropriate description. A move beyond either zone would challenge that view.
Overall, the daily structure leans constructive while support holds, but the weekly downtrend argues for caution until price can overcome the daily resistance zone.
Closing view
The key question is whether BTCUSD can regain the 0.382 Fibonacci level and then test daily resistance, or whether sellers push price back through the broken-retest support zone. The reported levels define those competing possibilities without resolving them in advance.
This analysis is for general information only and is not investment advice. Markets involve risk, and readers are responsible for their own decisions.