
BTCUSD closed at 81680.46. The daily chart retains an uptrend, but its down sub-trend has brought price close to the 80277.00 – 81509.20 broken-retest support zone. The weekly primary trend remains down, so the short-term pullback and the larger context point in different directions.
Higher-timeframe context
The weekly primary trend is down (firm), while the sub-trend is up. No weekly structure event is reported. The latest confirmed weekly swing is a low at 59783.75; the report does not identify a newer confirmed swing high or specify a higher-high/higher-low or lower-high/lower-low sequence.
Price is within the weekly 80538.63 – 84683.30 broken-retest resistance zone. Above it, the next reported resistance zone is 94783.62 – 97971.19; the reported weekly support zone is 59783.75 – 69241.82. Weekly EMA values and their relationship to price are not available in the deterministic data, so they cannot be assessed here.
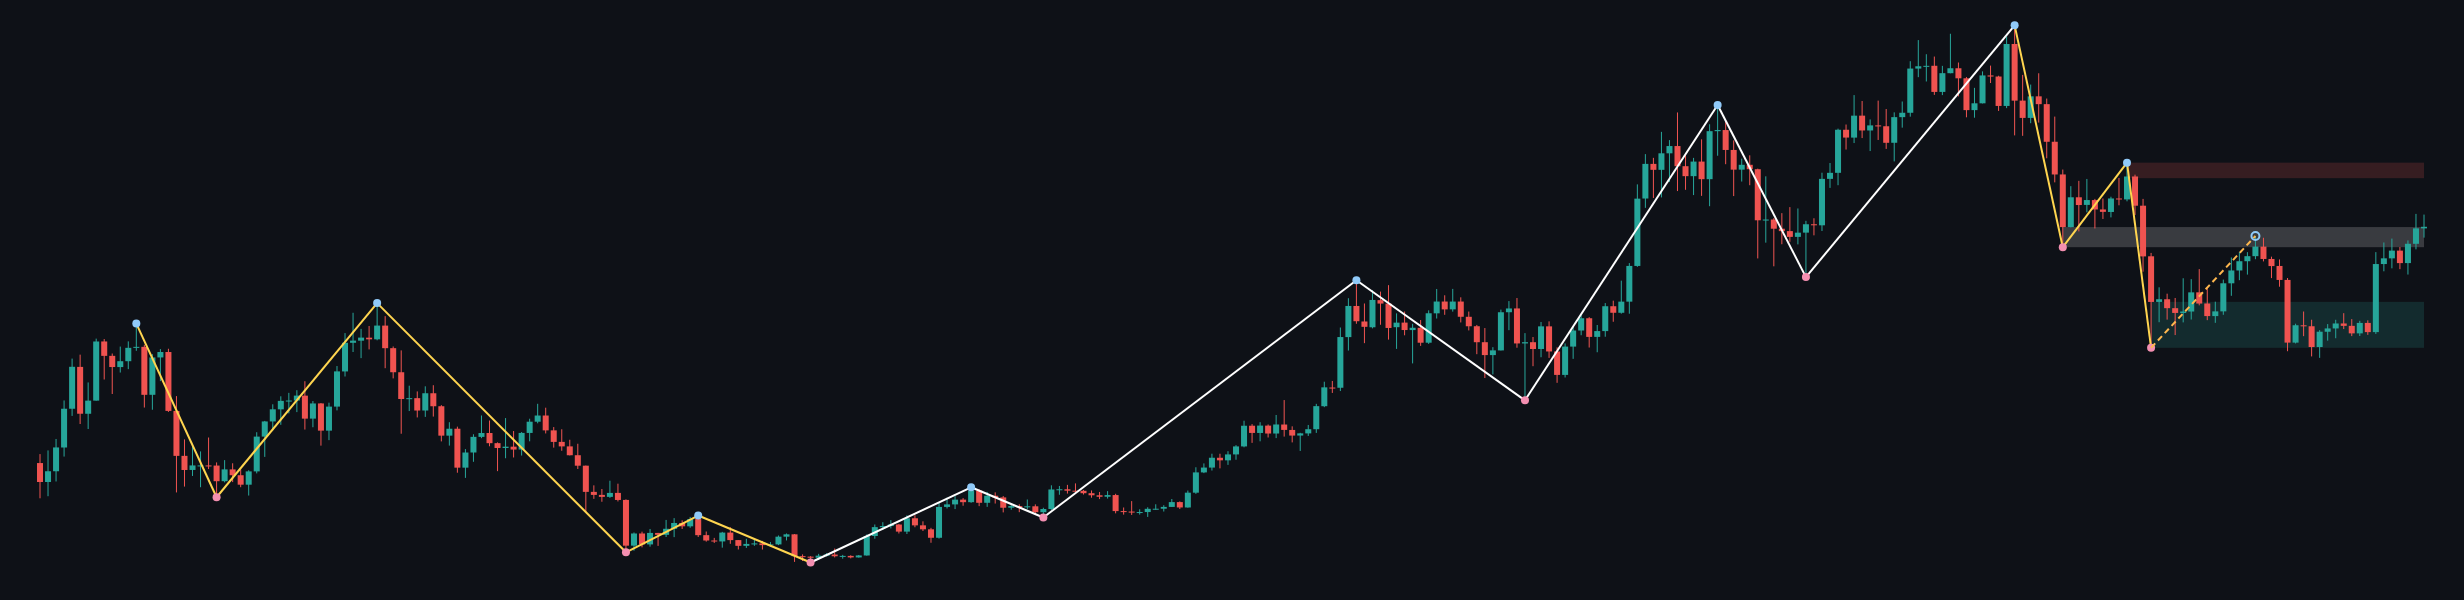
The weekly framework therefore remains cautious despite the upward sub-trend: sustained acceptance above the broken-retest band would improve the picture, while renewed weakness would leave the broader downtrend in focus.
Main-frame structure
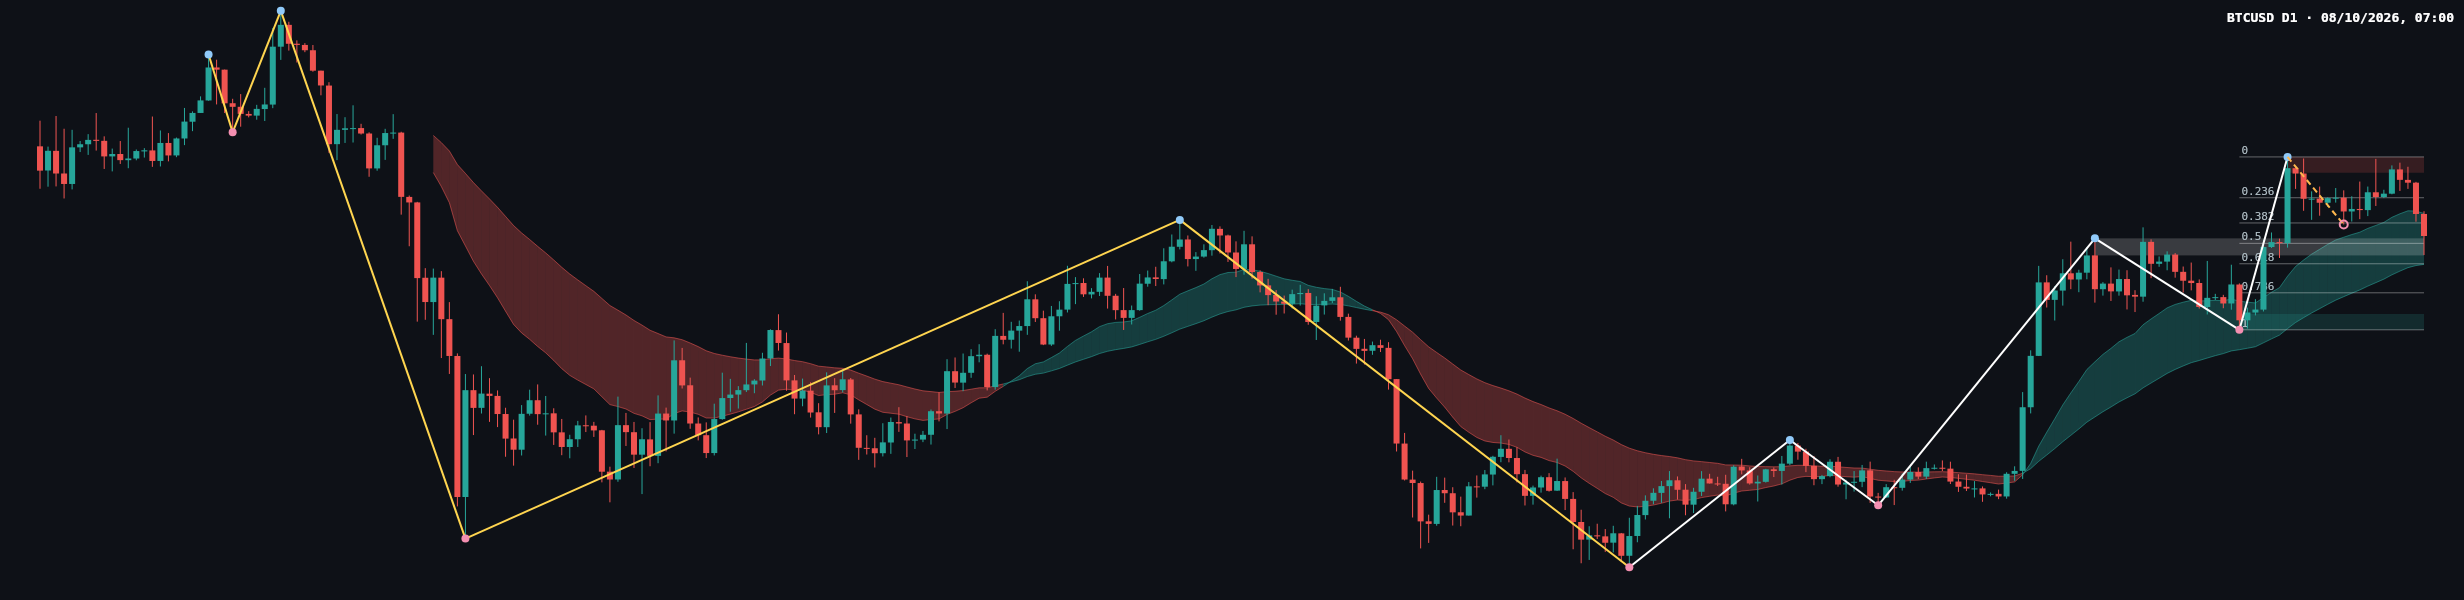
On the daily chart, the primary trend is up (firm) and the sub-trend is down. This is a pullback within the reported uptrend unless price action establishes a reversal; no daily structure event is reported. The latest confirmed swing is a high at 87401.93.
The latest close, 81680.46, is just above the daily broken-retest support zone of 80277.00 – 81509.20. The chart shows a recent upswing followed by a retreat from the swing high. The latest visible candle is bearish, but exact open, high, and low values are not supplied, so its range and close location within the candle cannot be measured. Daily EMA readings, volume, and momentum values are also not provided.
The latest completed daily Fibonacci leg runs from 74892.24 to 87401.93. The current retracement ratio is 0.457, between the reported 0.382 level at 82623.23 and the 0.5 level at 81147.08. Price is below 82623.23 and above 81147.08, with the latter close to the broken-retest support zone. The next lower listed Fibonacci levels are 0.618 at 79670.94 and 0.786 at 77569.31.
Key levels
| Area | Reported level | Why it matters |
|---|---|---|
| Daily resistance | 86258.39 – 87401.93 | Overhead zone, including the latest confirmed daily swing high. |
| Fibonacci reference | 82623.23 | The 0.382 retracement, above the latest close. |
| Nearby daily support | 80277.00 – 81509.20 | Broken-retest zone; price is currently just above its upper boundary. |
| Lower Fibonacci references | 81147.08 and 79670.94 | The 0.5 and 0.618 retracements. |
| Lower daily support | 74892.24 – 76035.78 | Next reported daily support zone below the retracement references. |
| Weekly broken-retest area | 80538.63 – 84683.30 | Relevant broader-timeframe zone around the current market. |
Scenarios
- Bullish case: If price holds the daily broken-retest support zone and reclaims 82623.23, the pullback could ease and attention could return to the daily resistance zone at 86258.39 – 87401.93. A move below 80277.00 would weaken this scenario.
- Bearish case: If price breaks below 80277.00 – 81509.20 and cannot recover the zone, the lower Fibonacci references at 79670.94 and 77569.31 become relevant, with the daily support zone at 74892.24 – 76035.78 farther below. A recovery above 82623.23 would weaken this case.
- Consolidation case: If neither the support zone nor 82623.23 is decisively cleared, price may continue to rotate around the nearby retracement and retest levels. A sustained move beyond either boundary would argue against this range-bound reading.
These are conditional paths, not forecasts with assigned probabilities: the supplied report provides no probability estimates. The key near-term question is whether buyers can defend the nearby daily support zone or sellers can extend the pullback through it.
BTCUSD remains technically mixed across timeframes. A hold and recovery would support the daily uptrend, while a clear loss of the retest zone would put lower retracement and support areas in focus.
This article is technical analysis for reference only, not investment advice. Markets carry risk, and readers are responsible for their own decisions.